










Anzen InvIT AUM hits 3.8 times listing level as income rises
Key highlights
- Anzen InvIT reported Q2 FY27 consolidated total income of Rs 300.4 crore, versus Rs 63.2 crore in Q2 FY25.
- Anzen InvIT’s AUM was Rs 8,650 crore in September 2026, about 3.8 times its Rs 2,280 crore listing level.
- Anzen InvIT reported Q2 FY27 EBITDA of Rs 253.7 crore, compared with Rs 82.5 crore in Q2 FY26.
- Anzen InvIT reported a Q2 FY27 distribution of Rs 3.00 per unit and cumulative distributions of Rs 832.8 crore since listing.
powered by IRIS
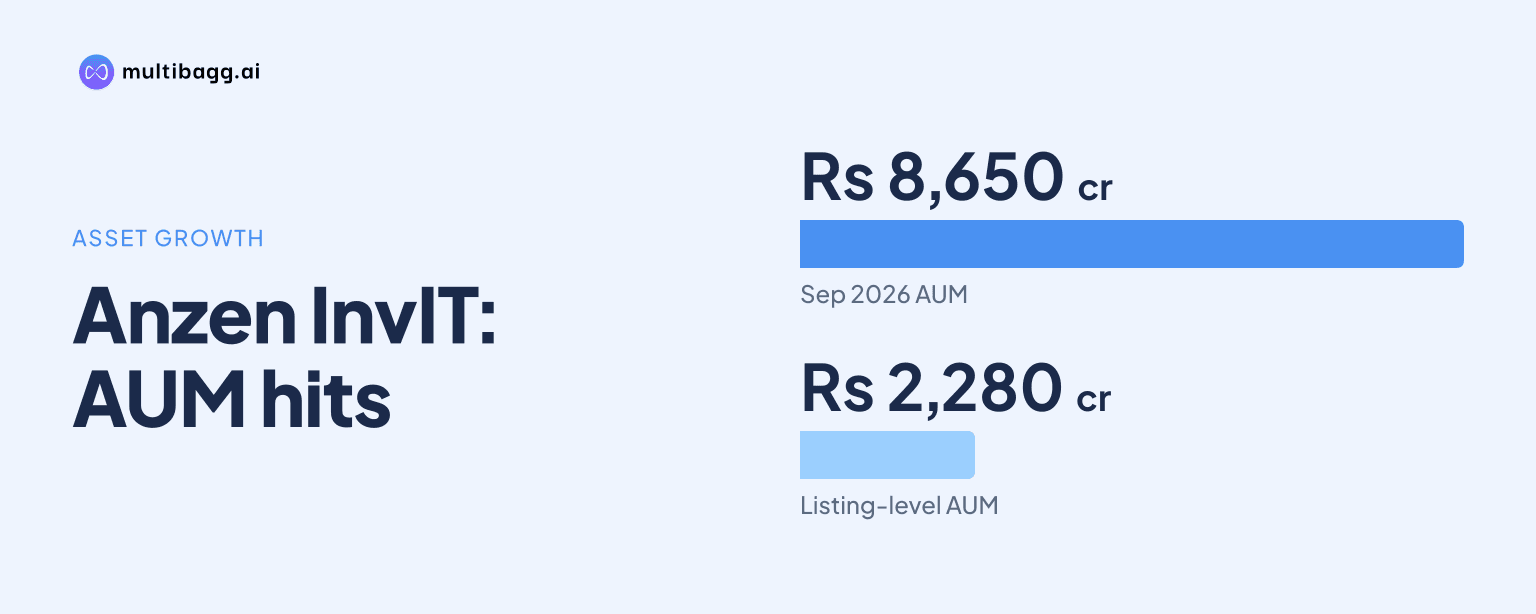
Anzen India Energy Yield Fund Trust reported Rs 300.4 crore of consolidated total income in Q2 FY27 as assets under management reached Rs 8,650 crore in September 2026, about 3.8 times the Rs 2,280 crore recorded at its November 2022 listing. The presentation also reports Q2 EBITDA of Rs 253.7 crore.
Know Anzen India Energy Yield Plus Trust inside out
Results, valuation, peers and who's buying, in one view.
How much did Anzen InvIT’s income and EBITDA grow?
Anzen InvIT’s consolidated total income rose to Rs 300.4 crore in Q2 FY27, from Rs 63.2 crore in Q2 FY25, representing the reported 4.8-times growth over two years. Income was Rs 103.1 crore in Q2 FY26 and Rs 289.2 crore in Q1 FY27, making Q2 FY27 income Rs 197.3 crore higher year on year and Rs 11.2 crore above the preceding quarter.
Consolidated earnings before interest, tax, depreciation and amortisation, or EBITDA, reached Rs 253.7 crore in Q2 FY27, compared with Rs 56 crore in Q2 FY25, Rs 82.5 crore in Q2 FY26 and Rs 232.2 crore in Q1 FY27. The presentation describes EBITDA growth from Q2 FY25 as about 4.5 times and cites compound annual growth rates of about 118% for total income and 113% for EBITDA between Q2 FY25 and Q2 FY27.
The income and EBITDA figures include 100% of the revenue and EBITDA of the Sigma portfolio, rather than only Anzen InvIT’s equity interest in those assets. This treatment is material because the September 2026 AUM calculation considers enterprise value for 12 Sigma solar assets corresponding to a 74% equity shareholding.
How did Anzen InvIT’s AUM change since listing?
Anzen InvIT’s AUM increased from Rs 2,280 crore in November 2022 to Rs 8,650 crore in September 2026, a rise of Rs 6,370 crore and about 3.8 times the listing level. The presentation reports an AUM compound annual growth rate of about 42% over this period.
The AUM path accelerated after March 2024. It was Rs 2,320 crore in March 2023 and Rs 2,300 crore in March 2024, before reaching Rs 3,930 crore in March 2025 and Rs 6,560 crore in March 2026. AUM then rose to Rs 8,730 crore in June 2026 before declining by Rs 80 crore to Rs 8,650 crore in September 2026.
September 2026 AUM is enterprise value under an independent valuer’s fair valuation report dated October 29, 2026. The presentation’s portfolio summary lists 16 projects across eight states and seven counterparties, comprising about 1,244 megawatt-peak of solar capacity and about 1,835 circuit kilometres of transmission lines plus two substations.
The asset listing identifies 13 solar projects and three transmission projects. Separately, the AUM note refers to 12 Sigma solar assets, indicating that the portfolio listing and the valuation perimeter are not described in identical terms in the presentation.
Got a follow-up? Ask IRIS
What revenue mix and contract profile does Anzen InvIT report?
Anzen InvIT derived about 63% of H1 FY27 revenue from transmission assets and 37% from solar assets. The reported mix combines regulated transmission assets with renewable projects supported by long-term power purchase agreements, or PPAs.
The portfolio had a weighted average operational history of 8.6 years and a weighted average residual contracted life of 20.1 years. The residual-life measure is calculated from remaining PPA and transmission service agreement, or TSA, terms, weighted by H1 FY27 revenue for the relevant special purpose vehicles.
Anzen InvIT reported that 88% of H1 FY27 unaudited revenue came from Tier 1 counterparties, while other counterparties accounted for 12%. The presentation defines a Tier 1 counterparty as one with a long-term credit rating of A+ or above.
The solar assets are located in Rajasthan, Andhra Pradesh, Uttar Pradesh, Punjab and Telangana. The transmission assets are in Karnataka, the Haryana-Punjab corridor and Bihar, so the reported Q2 FY27 income of Rs 300.4 crore reflects assets across both generation and transmission categories.
What did Anzen InvIT report on distributions and NAV?
Anzen InvIT reported a distribution per unit, or DPU, of Rs 3.00 for Q2 FY27, unchanged from Q1 FY27 and above Rs 2.75 in Q2 FY26 and Rs 2.45 in Q2 FY25. The Q2 FY27 distribution was Rs 100.8 crore, matching Q1 FY27 and exceeding the Rs 54 crore distributed in Q2 FY26.
The presentation states that the Q2 FY27 distribution was to be paid on or before November 12, 2026. Cumulative distributions since listing, including the Q2 FY27 distribution, were Rs 832.8 crore. It also reports a DPU compound annual growth rate of about 10.7% between Q2 FY25 and Q2 FY27.
Net asset value, or NAV, per unit was about Rs 129.61 at September 30, 2026, against the Rs 100 issue price in the November 2022 private placement. NAV per unit was Rs 131.4 in June 2026, meaning it declined by about Rs 1.8 during the September quarter.
Cumulative DPU, including Q2 FY27, was about Rs 40.26 per unit. The presentation calculates total investor gains of about Rs 69.87 per unit, or about 70% of the initial Rs 100 issue price, comprising about Rs 29.61 of NAV growth and Rs 40.26 of cumulative DPU.
Conclusion
Anzen InvIT’s presentation connects AUM growth from Rs 2,280 crore at listing to Rs 8,650 crore in September 2026 with Q2 FY27 income of Rs 300.4 crore and EBITDA of Rs 253.7 crore. The reported 63% transmission and 37% solar revenue split, together with 20.1 years of weighted average residual contract life, provides the disclosed operating context for that financial expansion.
The next disclosed event is payment of the Rs 3.00 Q2 FY27 distribution on or before November 12, 2026. The presentation also leaves two current measures to monitor: AUM declined from Rs 8,730 crore in June 2026 to Rs 8,650 crore in September 2026, while NAV per unit moved from Rs 131.4 to about Rs 129.61 over the same period.