










BLS E-Services Q2 FY27 Revenue Rises 57.3% to Rs 424.4 Crore
Key highlights
- BLS E-Services reported Q2 FY27 revenue from operations of Rs 424.4 crore, up 57.3% year on year.
- Q2 FY27 total income rose 55.1% year on year to Rs 428.1 crore.
- Operational EBITDA increased 43.8% year on year to Rs 28.8 crore in Q2 FY27.
- Q2 FY27 PAT rose 12.4% year on year to Rs 20.5 crore.
powered by IRIS
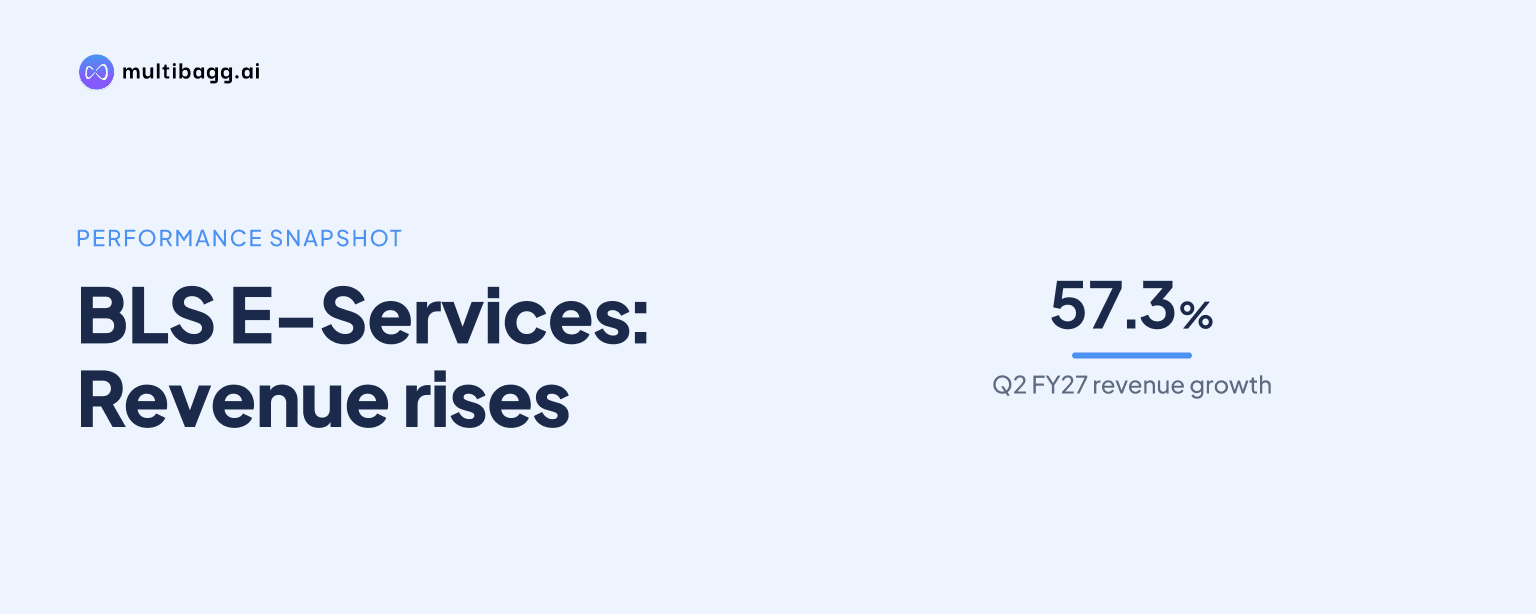
BLS E-Services Limited reported Q2 FY27 revenue from operations of Rs 424.4 crore, a 57.3% year-on-year increase from Rs 269.8 crore, while profit after tax rose 12.4% to Rs 20.5 crore for the quarter ended September 30, 2026. The result highlights continued expansion in its digital and financial-inclusion businesses.
Know BLS E-Services inside out
Results, valuation, peers and who's buying, in one view.
What did BLS E-Services report for Q2 FY27?
BLS E-Services reported consolidated total income of Rs 428.1 crore in Q2 FY27, compared with Rs 276.0 crore in the corresponding quarter of the previous year. Revenue from operations was Rs 424.4 crore, while the company reported profit after tax of Rs 20.5 crore.
The company announced its audited consolidated results on November 3, 2026, for the quarter ended September 30, 2026. In its results communication, Chairman Shikhar Aggarwal said the performance reflected momentum across key businesses and the growing scale of the company's digital and financial-inclusion platform.
Revenue growth was substantially faster than profit growth during the quarter. Revenue from operations increased by Rs 154.6 crore year on year, whereas PAT increased by Rs 2.2 crore. The reported operating profit margin was 6.8%.
How did quarterly revenue and income change from the previous quarter?
BLS E-Services reported a 39.6% quarter-on-quarter increase in revenue from operations, based on the quarterly earnings summary. The company generated Rs 424.4 crore of operating revenue in Q2 FY27 and reported total income of Rs 428.1 crore.
For the first half of FY27, revenue from operations stood at Rs 728.5 crore, compared with Rs 513.7 crore in the year-ago half, a 41.8% increase. Total income for the six-month period was Rs 737.9 crore, up 40.0% from Rs 527.2 crore.
The quarterly release attributed the revenue performance to steady business activity across the company's operating verticals. The available disclosure does not provide a segment-wise revenue split in the figures cited, so the contribution of individual business lines cannot be quantified from the reported data.
What do the operating profit and PAT figures show?
BLS E-Services reported EBITDA of Rs 32 crore for Q2 FY27, up 23.4% year on year, and operational EBITDA of Rs 28.8 crore, up 43.8% from Rs 20.0 crore. PAT was Rs 20.5 crore, compared with Rs 18.3 crore in Q2 FY26.
The results summary lists operating profit margin at 6.8%, while earnings per share was reported at Rs 0.96. Profit before tax was Rs 26 crore in the quarterly summary. These figures show that the company remained profitable as revenue scaled during the period.
The reported financial data also show a difference between the pace of revenue expansion and PAT growth. Revenue rose 57.3% year on year, while PAT increased 12.4%. The company disclosed the respective figures but did not provide, in the supplied material, a detailed reconciliation of every cost item behind the difference.
Got a follow-up? Ask IRIS
What has BLS E-Services disclosed to shareholders after the results?
BLS E-Services said the audio recording of its earnings call held on November 4, 2026, was available on its website. The call covered operating and financial performance for the quarter ended September 30, 2026, allowing shareholders to access management commentary after the results announcement.
The company also made announcements under Regulation 30 of the Listing Obligations and Disclosure Requirements regulations. Its November 2 disclosure stated that Q2 FY27 total income was about Rs 428 crore, up 55.1% year on year, while the subsequent announcement addressed the availability of the earnings-call audio.
For investors, the key reported facts are the sharp rise in operating revenue, positive EBITDA growth and a smaller, though positive, increase in PAT. No share-price movement, dividend decision, revised guidance or future financial target for BLS E-Services was included in the supplied disclosures, so those matters cannot be assessed from these results alone.
Why do the Q2 FY27 figures matter for investors and operations?
The Q2 figures matter because they provide evidence of higher business volumes at BLS E-Services. Revenue from operations of Rs 424.4 crore was Rs 154.6 crore above the prior-year quarter, and first-half revenue of Rs 728.5 crore was Rs 214.8 crore higher than the corresponding FY26 period.
The company operates as a technology-enabled digital service provider, and management referred to the increasing scale of its digital and financial-inclusion platform. Its revenue and operational EBITDA growth therefore offer a measure of current activity across those businesses, although the supplied information does not separately quantify customer additions, transaction volumes or regional performance.
For the broader market, the results add a current data point on the financial performance of a listed provider of digital and assisted services. The disclosures do not state any direct impact on customers, employees, communities or industry pricing. Investors will need to rely on later filings and management disclosures for further evidence on revenue mix, costs and margins.
Conclusion
BLS E-Services delivered Q2 FY27 revenue from operations of Rs 424.4 crore, up 57.3% year on year, alongside total income of Rs 428.1 crore and PAT of Rs 20.5 crore. Operational EBITDA increased 43.8% to Rs 28.8 crore, indicating that operating profit also rose during a quarter of strong revenue growth.
The next disclosed reference point is the company's earnings-call material following the November 4, 2026 call and its future quarterly filings. Investors can watch for further details on revenue mix, operating costs, margins and the factors influencing the gap between revenue growth and PAT growth.