










Brahmaputra Infrastructure borrowings halve, equity hits Rs 388 crore
Key highlights
- BIL’s consolidated borrowings declined from Rs 332 crore in FY23 to Rs 165 crore in H1FY27.
- BIL’s total consolidated equity increased from Rs 151 crore in FY23 to Rs 388 crore in H1FY27.
- Non-current borrowings rose from Rs 23 crore in FY26 to Rs 60 crore in H1FY27.
- BIL reported total assets of Rs 785 crore in H1FY27, compared with Rs 717 crore in FY26.
powered by IRIS
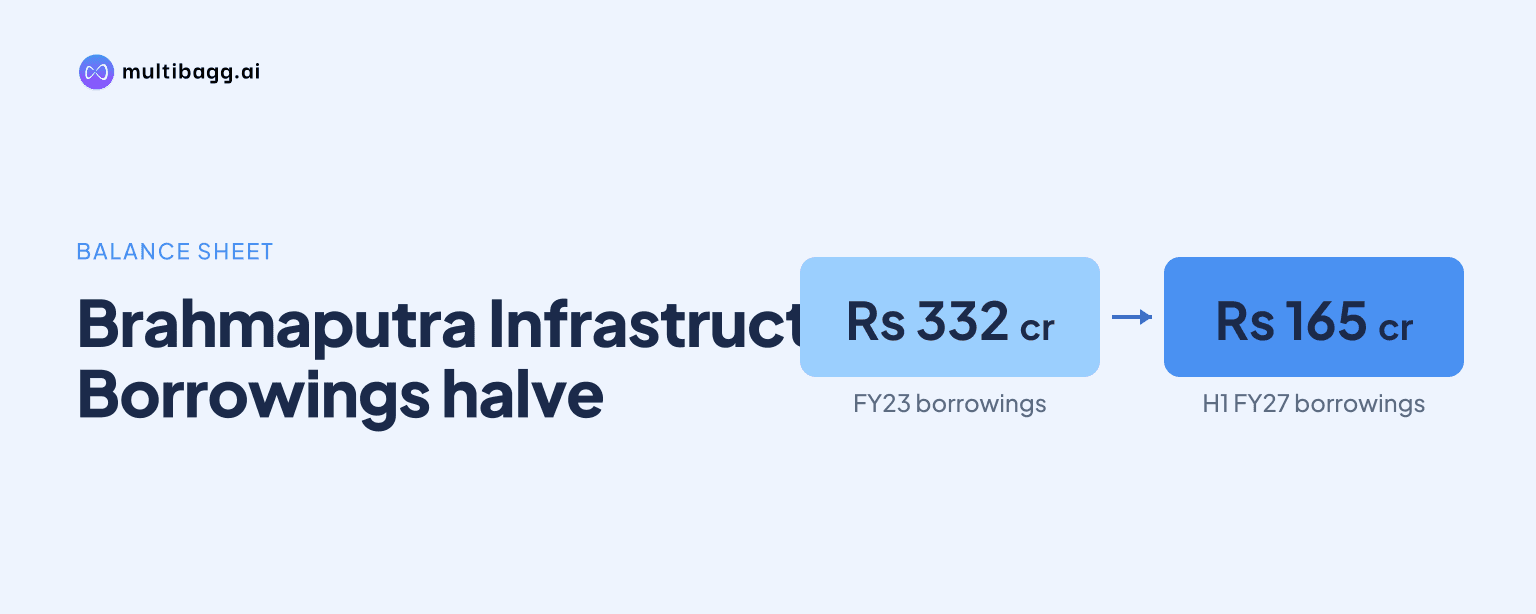
In H1FY27, Brahmaputra Infrastructure reported consolidated borrowings of Rs 165 crore, about half the Rs 332 crore recorded in FY23, while total equity reached Rs 388 crore. The reduction came primarily from lower current borrowings, although non-current borrowings increased from Rs 23 crore in FY26 to Rs 60 crore in H1FY27.
Know Brahmaputra Infrastructure inside out
Results, valuation, peers and who's buying, in one view.
How much has BIL reduced consolidated borrowings since FY23?
BIL reduced consolidated borrowings by Rs 167 crore, or about 50%, between FY23 and H1FY27. Total borrowings combine current and non-current borrowings: current borrowings declined from Rs 293 crore in FY23 to Rs 105 crore in H1FY27, while non-current borrowings moved from Rs 39 crore to Rs 60 crore over the same period. The balance-sheet change therefore chiefly reflects lower obligations classified as current.
BIL’s borrowings did not decline in every reported period. Total borrowings fell by Rs 101 crore from FY23 to FY24 and then declined by a further Rs 104 crore to Rs 127 crore in FY26. H1FY27 recorded a Rs 38 crore increase from FY26 because non-current borrowings rose by Rs 37 crore and current borrowings increased by Rs 1 crore. Even after that increase, total borrowings remained Rs 167 crore below the FY23 level.
The reduction was concentrated in current liabilities rather than across every liability line. Current liabilities overall declined from Rs 330 crore in FY23 to Rs 183 crore in H1FY27, a Rs 147 crore reduction. Trade payables were Rs 53 crore in H1FY27, below Rs 57 crore in FY26 but above Rs 14 crore in FY23, while other current liabilities stood at Rs 25 crore against Rs 23 crore in FY23.
Why did BIL’s non-current borrowings rise in H1FY27?
BIL’s non-current borrowings increased from Rs 23 crore in FY26 to Rs 60 crore in H1FY27, following declines from Rs 104 crore in FY24 to Rs 73 crore in FY25 and Rs 23 crore in FY26. This Rs 37 crore movement was the main reason consolidated non-current liabilities rose from Rs 192 crore to Rs 214 crore over the six-month period. The presentation does not state the purpose, lender, interest rate, maturity profile or security attached to the additional non-current borrowings.
The rise in non-current liabilities was not solely due to borrowings. Other financial liabilities increased from Rs 111 crore in FY26 to Rs 113 crore in H1FY27, while other non-current liabilities fell from Rs 58 crore to Rs 42 crore. Together, these movements produced the Rs 22 crore increase in total non-current liabilities. Relative to FY23, H1FY27 non-current liabilities of Rs 214 crore were Rs 98 crore higher, even as total borrowings were Rs 167 crore lower.
The increase in long-term borrowings also contrasts with BIL’s standalone balance sheet. Standalone non-current borrowings were Rs 30 crore in H1FY27, compared with Rs 23 crore in FY26, while consolidated non-current borrowings were Rs 60 crore. Consolidated current borrowings were Rs 105 crore and standalone current borrowings were Rs 104 crore in H1FY27. The presentation provides the balances but does not explain the Rs 30 crore difference in non-current borrowings between the two reporting bases.
Got a follow-up? Ask IRIS
How has BIL built equity alongside lower borrowings?
BIL’s total consolidated equity rose by Rs 237 crore, from Rs 151 crore in FY23 to Rs 388 crore in H1FY27. Other equity accounted for Rs 231 crore of that increase, rising from Rs 121 crore to Rs 352 crore, whereas share capital remained unchanged at Rs 29 crore through FY23 to H1FY27. Non-controlling interest was nil through FY26 and stood at Rs 6 crore in H1FY27.
The higher equity base coincided with growth in reported assets. Total assets increased by Rs 188 crore from Rs 597 crore in FY23 to Rs 785 crore in H1FY27. Non-current assets grew from Rs 244 crore to Rs 522 crore, including other non-current assets of Rs 413 crore in H1FY27 versus Rs 167 crore in FY23. Current assets declined from Rs 352 crore to Rs 263 crore over the same comparison, shifting the reported asset mix toward non-current assets.
BIL also reported several short-term asset movements between FY26 and H1FY27. Inventories declined from Rs 102 crore to Rs 91 crore, and debtors fell from Rs 19 crore to Rs 15 crore. Cash equivalents and bank balances increased from Rs 20 crore to Rs 23 crore, while other current assets rose from Rs 110 crore to Rs 133 crore. These line-item changes occurred alongside the Rs 68 crore increase in total assets from FY26 to H1FY27.
What should investors monitor in BIL’s next balance-sheet update?
Investors should monitor whether the Rs 60 crore of H1FY27 non-current borrowings remains elevated, declines or is joined by further current borrowing growth. BIL’s H1FY27 total borrowings of Rs 165 crore were Rs 38 crore above FY26’s Rs 127 crore, ending the decline recorded from FY24 through FY26. The presentation supplies no repayment schedule or use-of-proceeds explanation, so later balance sheets would show whether the H1FY27 increase was temporary or part of a funding requirement.
The disclosed expansion plans provide context for that monitoring but do not establish future borrowing outcomes. Management targets FY27 order inflow of Rs 1,200 crore and an approximately Rs 2,500 crore order book by FY28, while seeking an earnings before interest, tax, depreciation and amortisation margin above 20%. In real estate, BIL says its portfolio generates Rs 20 crore of recurring rental income and targets Rs 60 crore by FY29 through a new mall development and contractual rental escalations.
Conclusion
BIL’s consolidated balance sheet shows a substantial change since FY23: total borrowings fell from Rs 332 crore to Rs 165 crore while equity rose from Rs 151 crore to Rs 388 crore by H1FY27. The main mechanism was a Rs 188 crore reduction in current borrowings, alongside a Rs 231 crore increase in other equity, although total assets also expanded from Rs 597 crore to Rs 785 crore.
The next issue is whether H1FY27’s Rs 37 crore rise in non-current borrowings is sustained as BIL pursues its FY27 order-inflow target of Rs 1,200 crore and its real-estate plans. Management describes the new shopping mall and residential complex as likely to launch in FY2027, while another slide identifies FY28 for Phase 1 launch and projects commercial rental yield from FY29; the presentation does not reconcile those timing references.