










Brahmaputra Infrastructure Q2 sales rise 31%, EBITDA margin at 23%
Key highlights
- Brahmaputra’s consolidated 2QFY27 net sales rose 31% year on year to Rs 118 crore.
- Brahmaputra’s 2QFY27 PAT attributable to owners increased 37% to Rs 20 crore.
- Brahmaputra’s consolidated EBITDA margin declined 142 basis points year on year to 23% in 2QFY27.
- Brahmaputra reported a Rs 2,064.47 crore order book, including Rs 900 crore executable within 18 months.
powered by IRIS
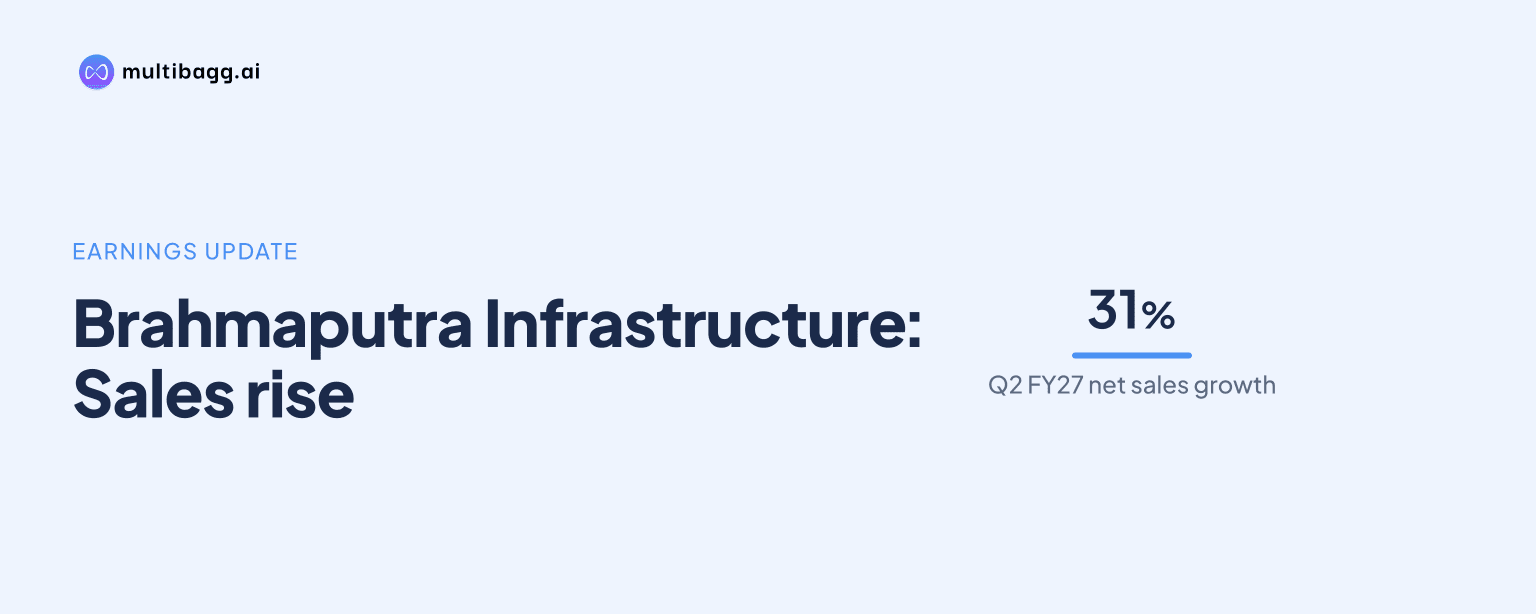
Brahmaputra Infrastructure reported consolidated 2QFY27 net sales of Rs 118 crore, up 31% year on year, and PAT attributable to owners of Rs 20 crore, up 37%, while EBITDA margin was 23%, down 142 basis points from 2QFY26. Cost of goods sold rose 35%, faster than sales growth.
Know Brahmaputra Infrastructure inside out
Results, valuation, peers and who's buying, in one view.
Why did Brahmaputra’s 2QFY27 profit rise despite lower EBITDA margin?
Brahmaputra’s profit after tax, or PAT, attributable to owners rose to Rs 20 crore in 2QFY27 from Rs 15 crore in 2QFY26, a 37% increase. Consolidated sales increased by Rs 28 crore to Rs 118 crore, while profit before tax rose 41% to Rs 24 crore from Rs 17 crore. Earnings before interest, tax, depreciation and amortisation, or EBITDA, increased 23% to Rs 27 crore, although that growth was below the sales increase.
Lower finance costs also accompanied the profit increase. Finance costs fell 31% year on year to Rs 4 crore in 2QFY27 from Rs 5 crore, while depreciation was Rs 33 lakh versus Rs 34 lakh. Tax, including deferred tax, rose to Rs 4 crore from Rs 3 crore, but profit before tax increased by Rs 7 crore on the company’s rounded figures.
What caused Brahmaputra’s EBITDA margin to decline?
Brahmaputra’s consolidated EBITDA margin declined to 23% in 2QFY27 from 25% a year earlier as cost of goods sold rose 35% to Rs 87 crore, exceeding the 31% increase in net sales to Rs 118 crore. EBITDA increased by Rs 5 crore to Rs 27 crore, compared with the Rs 28 crore increase in sales, and the company reported a 142-basis-point margin decline.
The quarter improved sequentially from 1QFY27. EBITDA margin was 21% in 1QFY27 and reached 23% in 2QFY27, a 242-basis-point increase, as sales rose 9% from Rs 108 crore and EBITDA rose 22% from Rs 23 crore. PAT increased 22% sequentially from Rs 16 crore, while PAT margin rose to 17% from 15%.
The consolidated outcome differed from the standalone result. Standalone sales rose 16% year on year to Rs 105 crore in 2QFY27, while standalone EBITDA margin increased to 26% from 25%. Consolidated sales were Rs 13 crore above the standalone figure, but consolidated cost of goods sold was Rs 87 crore and consolidated EBITDA margin was 23%.
How did Brahmaputra perform in H1FY27?
Brahmaputra reported consolidated net sales of Rs 226 crore in H1FY27, up 24% from Rs 182 crore in H1FY26, while PAT attributable to owners rose 23% to Rs 37 crore from Rs 30 crore. EBITDA increased 14% to Rs 50 crore from Rs 44 crore, trailing sales growth during the six-month period.
The H1FY27 EBITDA margin was 22%, down 209 basis points from 24% in H1FY26. Cost of goods sold rose 29% to Rs 168 crore from Rs 130 crore, compared with the 24% increase in sales. PAT margin was 16%, compared with 16% a year earlier, with Brahmaputra reporting a 15-basis-point decline based on rounded figures.
Finance costs fell 14% to Rs 8 crore in H1FY27 from Rs 10 crore in H1FY26. Profit before tax rose 28% to Rs 44 crore, while tax including deferred tax increased 58% to Rs 8 crore from Rs 5 crore. The half-year figures show lower finance costs alongside higher sales and a lower operating margin.
Got a follow-up? Ask IRIS
How does Brahmaputra’s latest margin compare with historical performance?
Brahmaputra’s 22% consolidated EBITDA margin in H1FY27 was below FY26’s 23% but above each reported full-year margin from FY22 through FY25. The historical series shows EBITDA margins of 18% in FY22, 20% in FY23, 19% in FY24 and 20% in FY25.
Consolidated sales rose from Rs 160 crore in FY22 to Rs 365 crore in FY26, while EBITDA increased from Rs 29 crore to Rs 83 crore. PAT attributable to owners rose from Rs 5 crore to Rs 60 crore, and PAT margin increased from 3% to 16%. H1FY27 sales of Rs 226 crore and PAT of Rs 37 crore exceed half of the FY26 reported figures, although the presentation does not provide a full-year FY27 forecast.
What order book supports Brahmaputra’s future execution?
Brahmaputra reported an order book of Rs 2,064.47 crore across four segments in Q2FY27, with Rs 900 crore, or 44%, identified as executable in the next 18 months. Buildings represented Rs 1,079.26 crore, or 52%, of the order book, followed by railways and tunnels at Rs 480.60 crore, or 23%.
Roads and bridges accounted for Rs 259.44 crore, or 13%, and river protection represented Rs 245.17 crore, or 12%. Brahmaputra also listed Rs 2,500 crore of tenders under evaluation, compared with secured order book of Rs 2,064 crore. The tenders are not described as secured orders in the presentation.
Brahmaputra listed Rs 317.01 crore of new order wins during Q2FY27. The largest was the Rs 137.60 crore Kokrajhar-Gelephu new broad-gauge rail-line project through the BIL-HBMPCL joint venture, followed by the Rs 89.73 crore bridge project through the BIL-GKCPL joint venture, for which the letter of acceptance was dated 08 October 2026. The listed projects have execution periods of 12 to 24 months, while the company cites an average completion time of 18 to 36 months.
Conclusion
Brahmaputra’s 2QFY27 figures show that consolidated sales and PAT rose 31% and 37%, respectively, while EBITDA margin fell to 23% as cost of goods sold grew 35%. The sequential margin recovery from 21% in 1QFY27 and finance costs of Rs 4 crore accompanied the quarterly profit outcome, but the H1FY27 operating margin of 22% remained below FY26’s 23%.
Next, investors can watch conversion of the Rs 900 crore order book identified as executable within 18 months, alongside progress on the Rs 317.01 crore of Q2FY27 order wins. Management’s stated way forward is a five-pillar strategy to grow the engineering, procurement and construction engine, scale recurring real-estate income and build on what it describes as FY26’s inflection.