










CASHurDRIVE FY26 profit reaches Rs 29.40 crore, receivables double
Key highlights
- CASHurDRIVE's FY26 revenue from operations was Rs 186.67 crore, compared with Rs 81.80 crore in FY23.
- CASHurDRIVE's FY26 EBITDA was Rs 33.58 crore and PAT was Rs 29.40 crore.
- CASHurDRIVE's trade receivables rose to Rs 74.82 crore in FY26 from Rs 37.06 crore in FY25.
- CASHurDRIVE reported FY26 operating cash outflow of Rs 19.56 crore and debt-to-equity of 0.01 times.
powered by IRIS
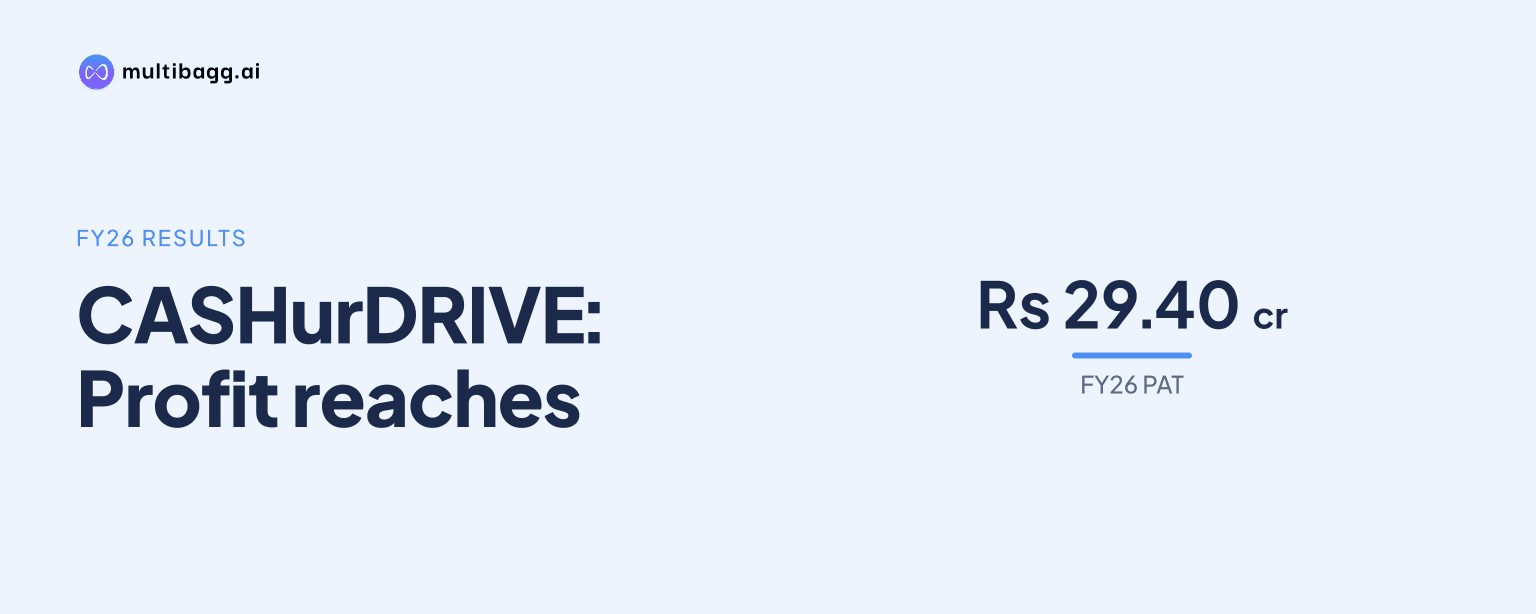
Cash Ur Drive Marketing Limited, branded as CASHurDRIVE, reported FY26 profit after tax of Rs 29.40 crore, up from Rs 5.56 crore in FY23, as revenue from operations rose to Rs 186.67 crore from Rs 81.80 crore; however, trade receivables doubled year on year to Rs 74.82 crore and operating cash flow was negative Rs 19.56 crore.
Know Cash UR Drive Marketing inside out
Results, valuation, peers and who's buying, in one view.
How quickly did CASHurDRIVE grow revenue and profit?
CASHurDRIVE increased revenue from operations 2.3 times between FY23 and FY26, while EBITDA and PAT rose more than fivefold. Revenue rose by Rs 104.87 crore over the period to Rs 186.67 crore in FY26, and the presentation calculates a revenue compound annual growth rate, or CAGR, of about 32% from FY23 to FY26.
CASHurDRIVE's earnings grew faster than revenue. Earnings before interest, tax, depreciation and amortisation, or EBITDA, reached Rs 33.58 crore in FY26 from Rs 6.47 crore in FY23, a 5.2-times increase, while profit after tax, or PAT, rose 5.3 times from Rs 5.56 crore to Rs 29.40 crore. The presentation puts PAT CAGR at about 74% for FY23 to FY26.
CASHurDRIVE's annual earnings acceleration was concentrated after FY24. EBITDA increased by Rs 1.49 crore in FY24, followed by increases of Rs 13.12 crore in FY25 and Rs 12.50 crore in FY26. PAT rose by Rs 6.30 crore in FY24, Rs 5.96 crore in FY25 and Rs 11.58 crore in FY26, while total income reached Rs 192.38 crore in FY26, including Rs 5.71 crore of other income.
Why did CASHurDRIVE's margins rise in FY26?
CASHurDRIVE's EBITDA margin increased to 17.99% in FY26 from 7.91% in FY23, while PAT margin rose to 15.28% from 6.69%. The presentation reports this as expansion of 1,008 basis points in EBITDA margin and 859 basis points in PAT margin over the four-year period.
CASHurDRIVE's EBITDA margin was broadly unchanged in FY24 before rising sharply. It edged down to 7.82% in FY24, then increased to 15.13% in FY25 and 17.99% in FY26. PAT margin improved in every year, moving from 6.69% in FY23 to 10.68% in FY24, 12.52% in FY25 and 15.28% in FY26.
Management attributes the margin movement to operating leverage, pricing improvement, cost control and a higher share of exclusive media. The presentation says exclusive media produces about twice the margin of trade media. It also reports FY26 asset utilisation of about 45% and management's target to increase utilisation to 50% to 55%.
CASHurDRIVE's FY26 revenue increased faster in absolute terms than its operating expenses. Revenue rose by Rs 47.35 crore from FY25 to Rs 186.67 crore, while operating expenses increased by Rs 33.33 crore to Rs 135.57 crore. Employee costs were Rs 10.58 crore in FY26, compared with Rs 9.15 crore in FY25, and other expenses were Rs 6.94 crore versus Rs 6.85 crore.
What happened to CASHurDRIVE's cash flow and receivables?
CASHurDRIVE reported negative operating cash flow of Rs 19.56 crore in FY26 after an outflow of Rs 24.92 crore in FY25, despite FY26 PAT of Rs 29.40 crore. Trade receivables rose to Rs 74.82 crore from Rs 37.06 crore in FY25, creating a contrast between reported profit and operating cash generation.
CASHurDRIVE's receivables were broadly stable at around Rs 37 crore in FY24 and FY25 before increasing by Rs 37.76 crore in FY26. Its receivable turnover ratio declined to 2.50 times in FY26 from 3.76 times in FY25, although it was slightly above the FY23 ratio of 2.43 times. Short-term loans and advances also rose to Rs 36.63 crore from Rs 5.77 crore in FY25.
CASHurDRIVE identifies working-capital intensity and receivables risk in its risk-management framework. Its stated measures are defined credit policies, active monitoring of debtor cycles and a balance between exclusive and trade media to optimise cash flows. The presentation does not disclose a receivables ageing schedule or a collection timeline.
Got a follow-up? Ask IRIS
How did CASHurDRIVE fund its FY26 balance-sheet expansion?
CASHurDRIVE reported financing cash inflow of Rs 53.36 crore in FY26, which offset negative operating cash flow of Rs 19.56 crore and investing outflow of Rs 8.65 crore. The result was a net increase in cash and cash equivalents of Rs 25.15 crore, taking cash and bank balances to Rs 33.25 crore from Rs 8.11 crore in FY25.
CASHurDRIVE's total assets expanded to Rs 202.89 crore in FY26 from Rs 94.55 crore in FY25. Current assets rose to Rs 155.13 crore from Rs 60.23 crore, including the increase in receivables and short-term loans and advances. Current liabilities increased to Rs 64.84 crore from Rs 39.44 crore, led by trade payables of Rs 58.52 crore against Rs 28.18 crore in FY25.
CASHurDRIVE ended FY26 with total equity of Rs 136.36 crore, compared with Rs 54.64 crore a year earlier. Long-term borrowings were Rs 1.17 crore and short-term borrowings were Rs 17 lakh at FY26-end. The reported debt-to-equity ratio was 0.01 times, versus 0.00 times in FY25 and 0.26 times in FY23.
CASHurDRIVE's fixed assets rose to Rs 8.20 crore in FY26 from Rs 2.25 crore in FY25, while non-current investments increased to Rs 32.08 crore from Rs 23.32 crore. The presentation characterises the business as asset-light and reports FY26 fixed-asset turnover of 22.77 times.
Which CASHurDRIVE ratios changed in FY26?
CASHurDRIVE's current ratio rose to 2.39 times in FY26 from 1.53 times in FY25, while return on equity declined to 21.56% from 32.62%. The current ratio reflected Rs 155.13 crore of current assets against Rs 64.84 crore of current liabilities at FY26-end.
CASHurDRIVE's return on capital employed, or ROCE, declined to 24.23% in FY26 from 38.10% in FY25. Return on equity, or ROE, had also declined from its FY24 high of 53.75% to 32.62% in FY25 and 21.56% in FY26. The FY26 ROCE was close to the FY23 reading of 24.30%, while FY26 ROE was below the FY23 level of 27.19%.
CASHurDRIVE's interest coverage ratio increased to 283.95 times in FY26 from 157.89 times in FY25. Finance costs declined marginally to Rs 12 lakh from Rs 13 lakh as EBITDA rose to Rs 33.58 crore. Earnings per share increased to Rs 21.24 in FY26 from Rs 14.28 in FY25 and Rs 4.29 in FY23.
Conclusion
CASHurDRIVE's FY23-FY26 financial record combines a 2.3-times increase in revenue with larger growth in EBITDA and PAT, alongside a substantial rise in margins. The FY26 balance sheet reported low borrowings relative to equity, but the cash-flow statement also shows two consecutive years of negative operating cash flow as receivables and short-term loans and advances increased.
The next disclosed operating measure to watch is management's target to raise utilisation from about 45% in FY26 to 50% to 55%. Receivables collection is also material: trade receivables stood at Rs 74.82 crore at FY26-end, receivable turnover declined to 2.50 times, and the presentation provides no ageing analysis or collection schedule.