










Castrol India revenue rose 27% as third-quarter profit fell
Key highlights
- Castrol reported 3Q CY 26 revenue from operations of Rs 1,735 crore, up 27% from Rs 1,363 crore in 3Q CY 25.
- Castrol’s 3Q CY 26 EBITDA was Rs 262 crore, down 19% from Rs 323 crore a year earlier.
- Castrol’s 3Q CY 26 PAT was Rs 176 crore, down 23% from Rs 228 crore in 3Q CY 25.
- Castrol said average B2B and Industrial volume sold grew by more than 10% year on year.
powered by IRIS
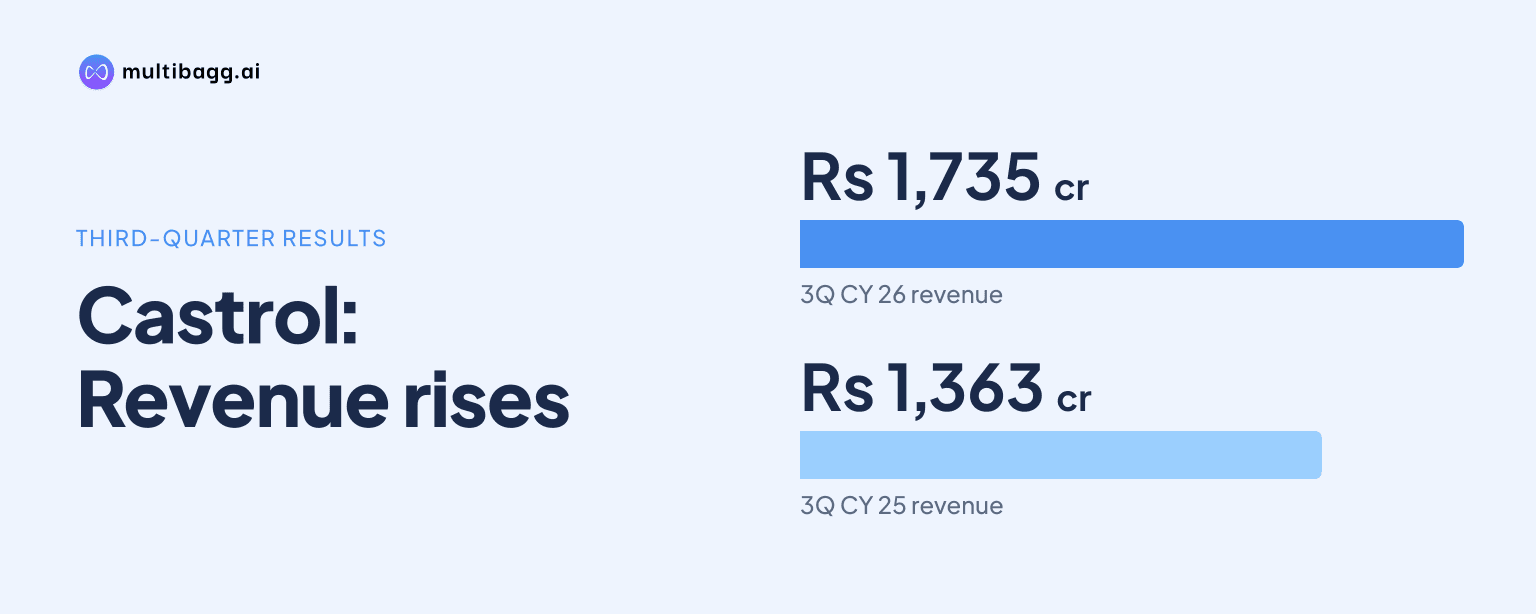
In 3Q CY 26, Castrol India reported revenue from operations of Rs 1,735 crore, up 27% from Rs 1,363 crore a year earlier, while EBITDA fell 19% to Rs 262 crore and profit after tax declined 23% to Rs 176 crore. The July-September presentation shows higher sales alongside lower reported profitability.
Know Castrol India inside out
Results, valuation, peers and who's buying, in one view.
What did Castrol report for 3Q CY 26?
Castrol reported revenue from operations of Rs 1,735 crore for 3Q CY 26, compared with Rs 1,363 crore a year earlier and Rs 1,288 crore in 3Q CY 24. The increase of Rs 372 crore from 3Q CY 25 equates to roughly 27%, taking quarterly revenue to the highest level in the five-year 3Q series shown in the presentation. The company labels the reported quarter as July-September.
Earnings moved in the other direction. EBITDA, which the presentation defines as excluding other income, was Rs 262 crore in 3Q CY 26, down from Rs 323 crore in 3Q CY 25. Profit after tax, or PAT, was Rs 176 crore, compared with Rs 228 crore a year earlier. The presentation reports the outcomes but does not state the reasons for the year-on-year decline in EBITDA or PAT.
How did Castrol’s profitability change despite higher revenue?
Castrol’s EBITDA margin, calculated by dividing reported EBITDA by revenue from operations, was about 15.1% in 3Q CY 26 versus about 23.7% in 3Q CY 25. That is a decline of about 8.6 percentage points, because revenue increased by Rs 372 crore while EBITDA decreased by Rs 61 crore. This is an analytical calculation from the presentation’s reported figures, not a margin measure separately disclosed by Castrol.
Castrol’s PAT margin similarly moved to about 10.1% from about 16.7% in the comparable quarter. PAT fell by Rs 52 crore year on year even as revenue reached Rs 1,735 crore. The gap between the top-line and earnings trends is the central feature of the quarter: the presentation provides the financial results and identifies channel volume growth, but it does not attribute the profit movement to costs, pricing, product mix, tax or any other factor.
Which Castrol channels and products were highlighted in the quarter?
Castrol said average volume sold in its business-to-business, or B2B, and Industrial channels grew by more than 10% versus 3Q CY 25. This channel measure is based on volume sold rather than revenue, and the presentation does not disclose revenue, profit or individual growth rates for B2B and Industrial separately. It also does not provide numerical shares for Consumer, original equipment manufacturer and Fleet, and Industrial in the 3Q CY 26 lubricants segment-contribution chart.
Castrol highlighted three product actions in industrial applications: the launch of Magna CTX circulating oils, and localisation of Hysol 35 XBB and Alusol 61 XBB. These actions appeared alongside the stated more-than-10% B2B and Industrial volume increase. For the consumer business, Castrol said it reinforced the MAGNATEC proposition around “non-stop protection even before you start,” referring to engine protection when the engine is switched off.
Castrol also reported availability at about 50,000 physical outlets under its “Step out sectors” heading. The presentation does not specify the prior-period outlet count, the locations of these outlets or the revenue they generated. Its marketing activity included a graduation-day ceremony for Super Mechanics participants, who received certificates, but no attendance number or commercial result was provided.
Got a follow-up? Ask IRIS
How does 3Q CY 26 compare with Castrol’s earlier quarters?
Castrol’s Rs 1,735 crore revenue in 3Q CY 26 exceeded each of the prior four third-quarter figures shown: Rs 1,121 crore in 3Q CY 22, Rs 1,183 crore in 3Q CY 23, Rs 1,288 crore in 3Q CY 24 and Rs 1,363 crore in 3Q CY 25. Revenue was Rs 614 crore higher than in 3Q CY 22, a rise of roughly 55% over four years. The five-year sequence shows uninterrupted increases in third-quarter revenue.
The earnings sequence differs from revenue. EBITDA rose from Rs 257 crore in 3Q CY 22 to Rs 323 crore in 3Q CY 25 before declining to Rs 262 crore in 3Q CY 26, which was also below Rs 286 crore reported in 3Q CY 24. PAT followed a similar pattern, rising from Rs 187 crore in 3Q CY 22 to Rs 228 crore in 3Q CY 25 and then falling to Rs 176 crore in 3Q CY 26, below all four earlier quarters shown.
What does Castrol’s annual revenue record show?
Castrol’s annual revenue from operations increased to Rs 5,722 crore in calendar year 2025 from Rs 5,365 crore in 2024, a gain of Rs 357 crore. The 2025 total was also above Rs 5,075 crore in 2023 and Rs 4,774 crore in 2022. The presentation’s annual series records revenue only, so it does not provide annual EBITDA or PAT with which to compare the 3Q CY 26 profit decline.
Over the longer record, annual revenue rose from Rs 1,763 crore in 2006 to Rs 5,722 crore in 2025. The series also contains declines, including Rs 3,298 crore in 2015 after Rs 3,392 crore in 2014, and Rs 2,997 crore in 2020 after Rs 3,877 crore in 2019. The subsequent figures increased to Rs 4,192 crore in 2021 and then to the Rs 5,722 crore reported for 2025.
Conclusion
Castrol’s 3Q CY 26 figures show a clear split: revenue rose 27% year on year to Rs 1,735 crore, supported by more-than-10% average volume growth in B2B and Industrial channels, while EBITDA fell 19% to Rs 262 crore and PAT fell 23% to Rs 176 crore. The reported revenue outcome is the highest third-quarter figure in the five-year comparison, but the earnings outcomes are below 3Q CY 25 and 3Q CY 24.
What to watch next is whether Castrol provides an explanation for the divergence between its Rs 372 crore revenue increase and lower earnings measures. The presentation identifies the Rs 61 crore year-on-year EBITDA reduction and the Rs 52 crore PAT reduction, but it discloses no cause, margin target or recovery plan for the profit decline.