










City Union Bank NIM rises to 3.87%, guides 3.85%-3.95%
Key highlights
- City Union Bank’s NIM increased 9 basis points sequentially to 3.87% in 2QFY27 from 3.78% in 1QFY27.
- City Union Bank’s cost of funds fell 4 basis points to 4.74%, while its cost of deposits remained unchanged at 5.56%.
- City Union Bank’s profit after tax rose 27% year on year to Rs 416 crore in 2QFY27.
- City Union Bank’s gross non-performing asset ratio declined to 1.44% in 2QFY27 from 1.73% in 1QFY27.
powered by IRIS
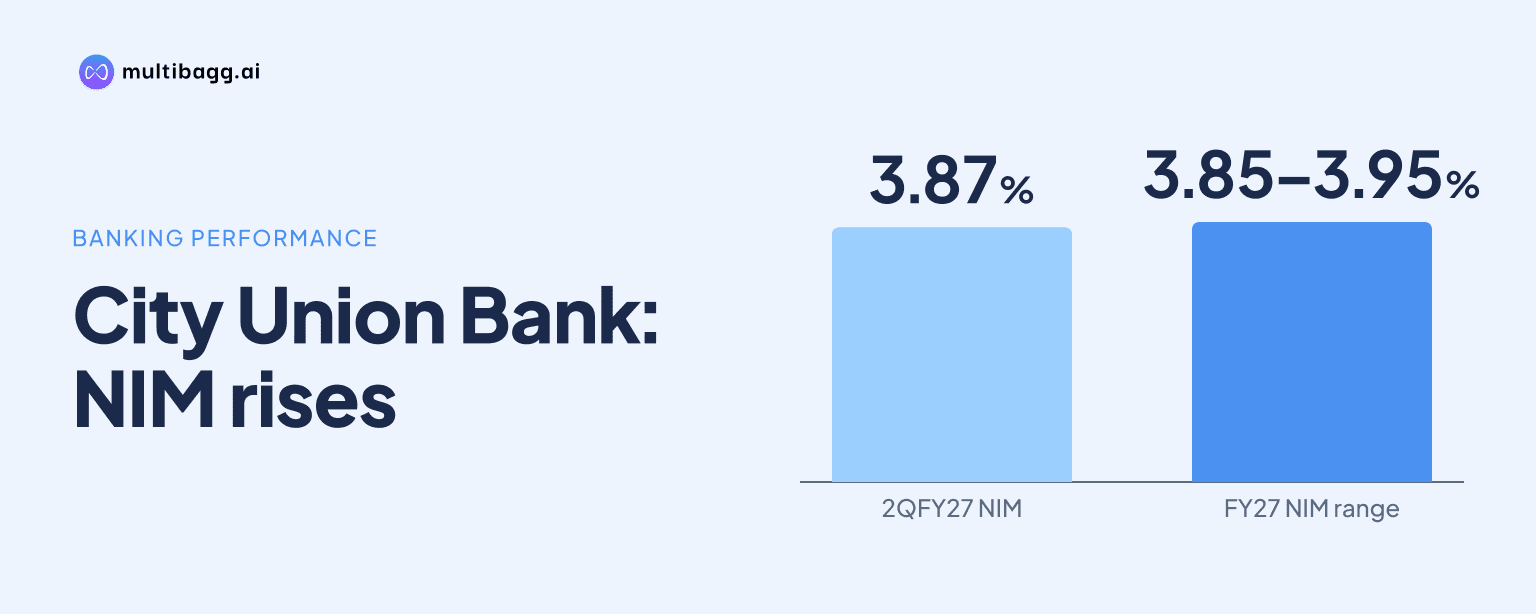
City Union Bank’s net interest margin, or NIM, increased to 3.87% in 2QFY27 from 3.78% in 1QFY27, contrary to management’s earlier expectation of a marginal decline. A 4-basis-point reduction in cost of funds to 4.74%, stable deposit costs and higher investment yield supported the result. Management projected NIM of 3.85% to 3.95% for Q3 and Q4.
Know City Union Bank inside out
Results, valuation, peers and who's buying, in one view.
Why did City Union Bank’s NIM rise in 2QFY27?
City Union Bank’s NIM rose because asset yields increased while deposit costs remained unchanged and overall funding costs declined. NIM increased by 9 basis points sequentially to 3.87% in 2QFY27, as yield on advances rose to 9.85% from 9.79% and the cost of funds fell to 4.74% from 4.78%. The cost of deposits was unchanged at 5.56% in both quarters.
The outcome differed from City Union Bank’s expectation during its Q1 earnings call, when management anticipated a marginal NIM decline because tight liquidity in June and July could increase deposit costs. Management said liquidity conditions subsequently eased following government measures involving Foreign Currency Non-Resident, or FCNR, deposits. The bank mobilised $69 million under a Reserve Bank of India swap, including $15 million from new-to-bank customers, and deployed the swapped rupee amount in domestic loans.
For 1HFY27, City Union Bank reported NIM of 3.83%, compared with 3.59% in 1HFY26. Interest income increased 25% to Rs 4,077 crore in the half year from Rs 3,258 crore a year earlier. In 2QFY27 alone, interest income grew 27% to Rs 2,092 crore from Rs 1,653 crore in 2QFY26.
How did investment allocation lift City Union Bank’s margins?
City Union Bank said moving out of mutual funds and into interest-income-earning investments increased investment yield and moved related income into interest income. The bank invested about Rs 850 crore in mutual funds during 1QFY27 and recorded Rs 12.5 crore of income as other income. In 2QFY27, it exited the mutual-fund investments and moved the funds into investments that earn interest income.
The allocation change increased the yield on investments to 6.56% in 2QFY27 from 6.42% in 1QFY27. City Union Bank said interest from the new investments was accounted for under interest income on investments in August 2026, rather than under other income as in Q1. This accounting treatment was one factor behind the higher investment yield and the sequential increase in NIM.
The investment change came alongside a higher advance yield of 9.85% in 2QFY27, against 9.79% in 1QFY27. For 1HFY27, yield on advances was 9.82%, compared with 9.73% in the corresponding period of FY26. City Union Bank’s margin improvement therefore reflected increased returns on both advances and investments, combined with a 4-basis-point reduction in the cost of funds.
Other income nevertheless increased 35% year on year to Rs 350 crore in 2QFY27 from Rs 259 crore. Management attributed the increase mainly to sales of technically written-off accounts to an asset reconstruction company, or ARC, and Rs 137 crore of collections from technically written-off accounts. The bank also received Rs 9.6 crore from selling excess agriculture priority-sector lending certificates during the quarter.
Got a follow-up? Ask IRIS
What is City Union Bank’s NIM outlook for Q3 and Q4?
City Union Bank projects NIM of 3.85% to 3.95% in both Q3 and Q4 of FY27. The guided range is 2 basis points below to 8 basis points above the 3.87% reported in 2QFY27. Management based the outlook on deposit rates not seeing an immediate change while liquidity remains ample, supported by FCNR deposit inflows.
Policy-rate transmission is another factor in the outlook because approximately 55% of City Union Bank’s loan portfolio is linked to the external benchmark lending rate, or EBLR. Management said the bank had started passing recent policy-rate changes to borrowers. This means lending yields on the EBLR-linked portion can change as those rate revisions are transmitted, while management said deposit pricing had not moved immediately.
Deposits increased 21% year on year to Rs 83,893 crore in 2QFY27 from Rs 69,486 crore in 2QFY26. They also rose by more than Rs 4,500 crore, or 6%, sequentially. The current-account and savings-account, or CASA, ratio remained 27% of deposits, while the average credit-deposit ratio was 86% in 2QFY27.
Management told an analyst that sustaining 20% deposit growth over the next two years would be challenging. It said City Union Bank had delivered consistent growth over the last couple of quarters through granular deposits and had not pursued bulk deposits. The disclosed NIM guidance, however, is tied to liquidity conditions and unchanged deposit rates rather than to a stated long-term deposit-growth target.
How did City Union Bank’s earnings and costs compare with last year?
City Union Bank’s profit after tax rose 27% year on year to Rs 416 crore in 2QFY27 from Rs 329 crore in 2QFY26. Profit after tax for 1HFY27 increased 26% to Rs 798 crore from Rs 635 crore in 1HFY26. Operating profit in the half year grew 35% to Rs 1,241 crore from Rs 922 crore in the corresponding period.
Operating expenses rose 24% to Rs 562 crore in 2QFY27 from Rs 455 crore a year earlier. Establishment expenses increased 25% to Rs 280 crore from Rs 224 crore after the annual wage hike was disbursed in the second quarter. Other operating expenses increased 22% to Rs 282 crore from Rs 231 crore.
The cost-to-income ratio declined to 45.96% in 2QFY27 from 49.16% in 2QFY26 despite the increase in operating expenses. For 1HFY27, the ratio was 45.71%, compared with 48.66% in 1HFY26. Management expects the FY27 cost-to-income ratio to remain largely within 45% to 47%, while return on assets was 1.62% in 2QFY27 versus 1.59% in 2QFY26.
Asset-quality movements also affected the quarter’s reported outcome. Recoveries of Rs 317 crore exceeded slippages of Rs 175 crore in Q2 FY27, resulting in negative credit cost, according to management. Gross non-performing assets fell to 1.44% in 2QFY27 from 1.73% in 1QFY27, while net non-performing assets declined to 0.48% from 0.90% in 2QFY26.
Conclusion
City Union Bank’s 3.87% NIM in 2QFY27 reflected stable deposit costs, lower overall funding costs and higher returns on advances and investments. The improvement reversed management’s earlier expectation of margin pressure and contributed to 1HFY27 NIM of 3.83%, compared with 3.59% in 1HFY26, alongside profit after tax of Rs 798 crore.
The next two quarters will show whether City Union Bank remains within its projected 3.85% to 3.95% NIM range as policy-rate changes pass through to the 55% of loans linked to EBLR. Management’s projection also depends on deposit rates remaining broadly unchanged amid FCNR-supported liquidity, while it has said maintaining 20% deposit growth over the next two years would be challenging.