










Concord H1FY27 revenue rises 95.1% as cash cycle declines
Key highlights
- Concord's H1FY27 revenue rose 95.1% year on year to Rs 159.1 crore.
- H1FY27 EBITDA increased 114.7% to Rs 46.7 crore, with a 29.32% margin.
- Concord's trailing 12-month cash conversion cycle declined 37 days to 338 days in H1FY27.
- Unexecuted order book was about Rs 846 crore at September 30, 2026, with an 18-to-24-month execution period.
powered by IRIS
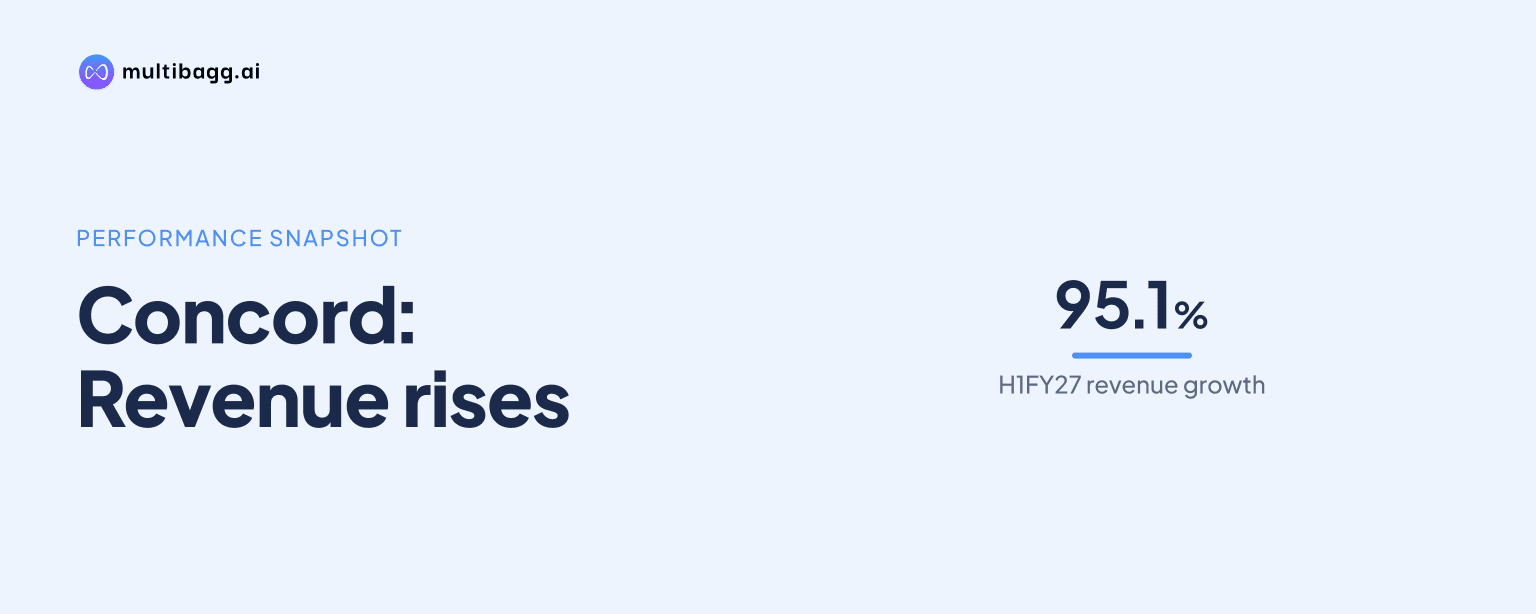
Concord Control Systems Limited reported H1FY27 revenue of Rs 159.1 crore, a 95.1% year-on-year increase, while Concord reduced its trailing 12-month cash conversion cycle by 37 days to 338 days. EBITDA rose 114.7% to Rs 46.7 crore and profit after tax increased 94.9% to Rs 31.2 crore.
Know Concord Control Systems inside out
Results, valuation, peers and who's buying, in one view.
How quickly did Concord's H1FY27 revenue and profit grow?
Concord's H1FY27 revenue from operations rose 95.1% year on year to Rs 159.1 crore, from Rs 81.5 crore in H1FY26. The first-half revenue figure also exceeded H2FY26 revenue of Rs 128.9 crore by 23.4%, showing a higher reported revenue level both year on year and half on half.
EBITDA, or earnings before interest, tax, depreciation and amortisation, grew faster than revenue, rising 114.7% to Rs 46.7 crore from Rs 21.7 crore. Profit after tax, or PAT, increased 94.9% to Rs 31.2 crore from Rs 16.0 crore, while earnings per share rose 89.8% to Rs 30.08 from Rs 15.85.
Concord had also reported FY26 revenue of Rs 210.5 crore, up 69.1% from Rs 124.5 crore in FY25. FY26 EBITDA was Rs 62.1 crore against Rs 29.7 crore in FY25, while FY26 PAT reached Rs 42.7 crore from Rs 22.7 crore, providing the full-year comparison disclosed before the H1FY27 result.
What happened to Concord's margins in H1FY27?
Concord's H1FY27 EBITDA margin was 29.32%, compared with 26.65% in H1FY26, an expansion of 267 basis points, where one basis point equals one-hundredth of a percentage point. The margin was below the 31.27% reported in H2FY26, a sequential decline of 195 basis points despite the 23.4% half-on-half revenue increase.
PAT margin was broadly unchanged year on year at 19.63% in H1FY27 versus 19.65% in H1FY26, a 2-basis-point movement. Against H2FY26, PAT margin declined by 102 basis points from 20.65%, while H1FY27 interest expense rose to Rs 3.2 crore from Rs 1.6 crore in H2FY26.
Concord recorded total expenditure of Rs 112.5 crore in H1FY27, up 88.0% from Rs 59.8 crore in H1FY26 but below the 95.1% rise in revenue. Depreciation rose to Rs 2.2 crore from Rs 1.1 crore, and tax expense increased to Rs 11.2 crore from Rs 4.3 crore over the same comparison.
How did Concord reduce its cash conversion cycle by 37 days?
Concord reduced its cash conversion cycle to 338 days in H1FY27 from 375 days in FY26, with both figures calculated on a trailing 12-month basis. The presentation describes the 37-day movement as an improvement in working-capital efficiency and cash-flow management.
The largest movement was in inventory days, which declined by 54 days to 259 from 313. Debtor days, which the presentation identifies as collection efficiency, declined by 32 days to 178 from 210, contributing to the lower cash conversion cycle.
Payable days declined by 49 days to 100 in H1FY27 from 149 in FY26. The presentation says faster payments partly offset the gains from debtor and inventory days, while linking the shorter payable period to liquidity and cash position.
Got a follow-up? Ask IRIS
What do Concord's balance-sheet balances show after H1FY27 growth?
Concord's trade receivables were Rs 140.76 crore at H1FY27, compared with Rs 121.19 crore at FY26 and Rs 37.62 crore at FY25. Inventories reached Rs 104.08 crore, up from Rs 88.59 crore at FY26 and Rs 37.58 crore at FY25, so the absolute balances increased even as the days-based measures declined.
Cash and cash equivalents increased to Rs 34.48 crore at H1FY27 from Rs 16.68 crore at FY26. Total current assets rose to Rs 299.55 crore from Rs 235.29 crore, and total assets increased to Rs 382.58 crore from Rs 315.71 crore over the same period.
Short-term borrowings increased to Rs 70.97 crore at H1FY27 from Rs 39.15 crore at FY26, while long-term borrowings fell to Rs 11.36 crore from Rs 14.84 crore. Trade payables declined to Rs 40.02 crore from Rs 42.04 crore, and total current liabilities rose to Rs 126.38 crore from Rs 87.14 crore.
Total equity was Rs 240.52 crore at H1FY27, compared with Rs 209.29 crore at FY26 and Rs 119.18 crore at FY25. Reserves and surplus rose to Rs 230.14 crore from Rs 198.91 crore at FY26, while fixed assets increased to Rs 31.89 crore from Rs 29.31 crore.
What order book supports Concord's planned revenue execution?
Concord reported an unexecuted order book of about Rs 846 crore at September 30, 2026, equivalent to four times FY26 revenue of Rs 210.5 crore. The company reported Rs 697 crore of opening order book, Rs 308 crore of orders received and Rs 159.1 crore of orders executed in the stated order-book bridge.
Management indicated an execution period of 18 to 24 months for the unexecuted orders. Its stated focus for the current year is translating the order book into revenue while demonstrating disciplined cash-flow management, connecting the order backlog with the H1FY27 working-capital data.
The order book relates to Concord's rail-focused technology platform, which the presentation describes as safety, control, propulsion and diagnostics. Concord identifies Kavach, DPWCS, zero-emission propulsion, diagnostics and Fusion as future growth engines, without providing revenue targets for those categories.
Conclusion
Concord combined H1FY27 revenue growth of 95.1% with EBITDA growth of 114.7% and a 37-day reduction in its trailing cash conversion cycle. Inventory days fell 54 days and debtor days fell 32 days, although receivables of Rs 140.76 crore, inventories of Rs 104.08 crore and short-term borrowings of Rs 70.97 crore were higher than their FY26 balances.
The next disclosed operating test is execution of the approximately Rs 846 crore unexecuted order book over the stated 18-to-24-month period. Investors can watch whether order conversion sustains reported revenue growth while debtor days, inventory days, payable days and the 338-day cash conversion cycle move in line with management's cash-flow discipline focus.