










CSL Finance Q2 disbursements hit ₹385 crore, PAT gains 2%
Key highlights
- CSL Finance disbursed ₹385 crore in Q2FY27, up 31% year on year and 20% quarter on quarter.
- CSL Finance’s AUM reached ₹1,627 crore in Q2FY27, up 16% from ₹1,397 crore a year earlier.
- CSL Finance’s NII increased 21% year on year to ₹49.6 crore, while PAT rose 2% to ₹25 crore.
- CSL Finance reported gross NPA of 1.13% in Q2FY27, compared with 0.51% in Q2FY26.
powered by IRIS
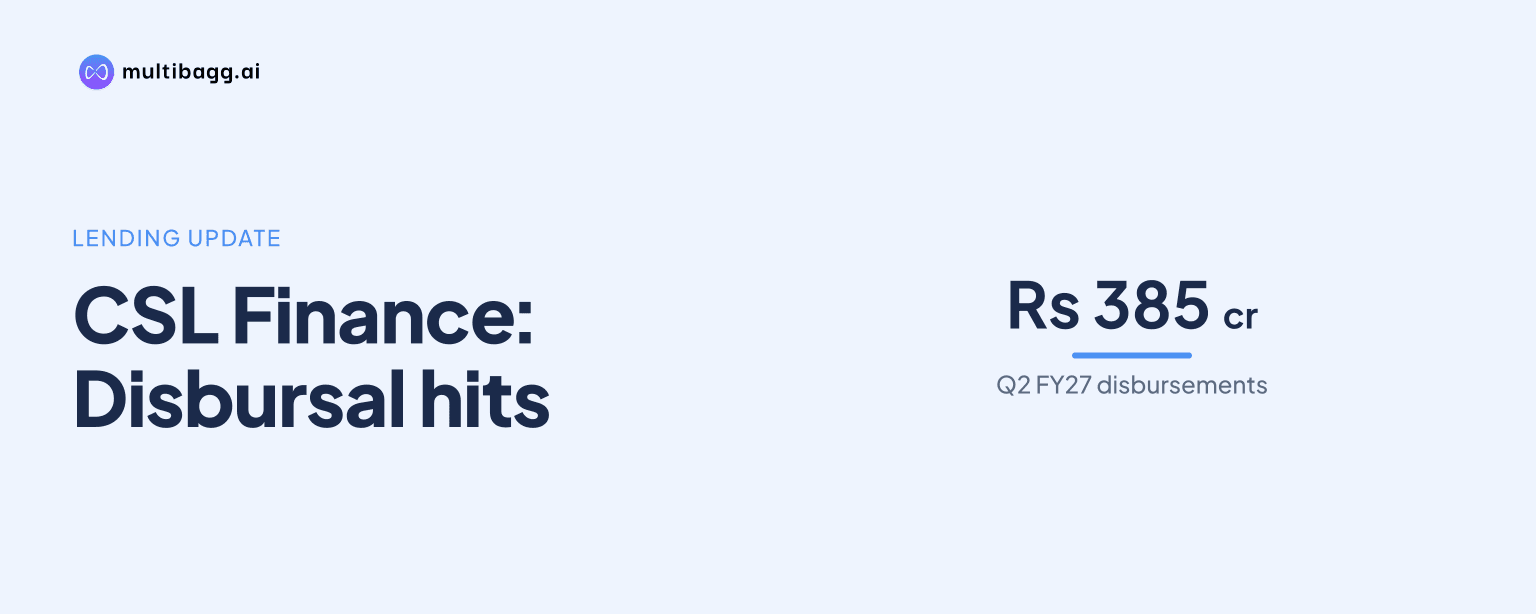
CSL Finance Limited recorded ₹385 crore of disbursements in Q2FY27, the highest figure in its disclosed five-quarter series, while profit after tax rose 2% year on year to ₹25 crore. Assets under management reached ₹1,627 crore, up 16%, and net interest income increased 21% to ₹49.6 crore.
Know CSL Finance inside out
Results, valuation, peers and who's buying, in one view.
What drove CSL Finance’s Q2FY27 disbursement growth?
CSL Finance disbursed ₹385 crore in Q2FY27, up 31% from ₹293 crore in Q2FY26 and 20% from ₹321 crore in Q1FY27. The Q2FY27 amount also exceeded ₹357 crore in Q3FY26 and ₹301 crore in Q4FY26, making it the highest quarterly disbursement in the five periods presented.
Collections rose more slowly than originations. CSL Finance collected ₹298 crore in Q2FY27, compared with ₹256 crore in Q2FY26 and ₹283 crore in Q1FY27, representing 16% year-on-year growth and 5% quarter-on-quarter growth. Disbursements therefore exceeded collections by ₹87 crore during Q2FY27, compared with a ₹38 crore gap in Q1FY27.
Collection efficiency was 99% in Q2FY27, compared with 98% in Q2FY26 and each of Q3FY26, Q4FY26 and Q1FY27. The presentation reports the improvement alongside the rise in collections to ₹298 crore, but does not provide a further explanation of the collection-efficiency calculation.
How did CSL Finance’s loan book and portfolio mix change?
CSL Finance’s assets under management, or AUM, rose 16% year on year to ₹1,627 crore in Q2FY27 from ₹1,397 crore in Q2FY26. The total was also 8% above Q1FY27, when on-book AUM was ₹1,472 crore and off-book AUM was ₹33 crore.
On-book AUM, representing loans held on CSL Finance’s balance sheet, reached ₹1,578 crore in Q2FY27 from ₹1,309 crore a year earlier. Off-book AUM was ₹50 crore, down from ₹88 crore in Q2FY26 but above ₹33 crore in Q1FY27, showing that most of the year-on-year AUM increase came from the on-book portfolio.
The AUM mix moved further towards wholesale lending. Small and medium enterprise, or SME, retail accounted for 27% of AUM and wholesale accounted for 73% in Q2FY27, compared with a 34:66 split in Q2FY26. The presentation describes this as a 7% shift in favour of wholesale, without disclosing the individual products behind the movement.
Why did CSL Finance’s income grow faster than profit?
CSL Finance’s net interest income, or NII, grew 21% year on year to ₹49.6 crore in Q2FY27 from ₹40.9 crore in Q2FY26. NII was also 10% above ₹45 crore in Q1FY27, and the presentation defines it as interest income plus fees and commission income less finance costs.
Total income increased at the same reported rates as NII, rising 21% year on year and 10% quarter on quarter to ₹77.4 crore in Q2FY27. It stood at ₹63.8 crore in Q2FY26 and ₹70.3 crore in Q1FY27, while Q2FY27 NII of ₹49.6 crore represented the largest NII figure in the five-quarter series.
Profit after tax, or PAT, rose only 2% year on year to ₹25 crore from ₹24.5 crore in Q2FY26, although it was 13% above ₹22.1 crore in Q1FY27. The presentation does not state why PAT growth lagged the 21% increase in NII and total income, so it does not identify a specific cost, credit or tax factor for the difference.
Got a follow-up? Ask IRIS
What changed in CSL Finance’s asset quality?
CSL Finance reported gross non-performing assets, or gross NPA, of 1.13% in Q2FY27, up from 0.51% in Q2FY26 and 0.95% in Q1FY27. The year-on-year increase was 62 basis points and the quarter-on-quarter increase was 18 basis points, according to the presentation.
Net NPA increased to 0.71% in Q2FY27 from 0.39% a year earlier and 0.60% in Q1FY27. Provision coverage ratio declined to 110% from 229% in Q2FY26 and 123% in Q1FY27, while write-offs were ₹2.1 crore in Q2FY27 compared with ₹1.3 crore a year earlier.
Gross Stage 3 assets, which the presentation equates with gross NPA under its expected credit loss framework, were ₹17.84 crore in Q2FY27 versus ₹6.58 crore in Q2FY26. Expected credit loss, or ECL, provision for Stage 3 was ₹6.70 crore, and the Stage 3 ECL provision percentage was 37.57%, compared with 23.35% a year earlier.
The presentation notes a change in ECL provisioning policy in line with changes suggested by the Reserve Bank of India. Total ECL provisions were ₹19.67 crore in Q2FY27, compared with ₹15.07 crore in Q2FY26, while the total ECL provision percentage increased to 1.25% from 1.17%.
How did CSL Finance’s lending yields change by segment?
CSL Finance’s wholesale yield was 16.8% in Q2FY27, up from 16.5% in Q2FY26 and 16.6% in Q1FY27. SME retail yield was 18.1%, compared with 18.2% in both Q2FY26 and Q1FY27, leaving the SME retail yield 1.3 percentage points above wholesale in Q2FY27.
The wholesale AUM share increased to 73% in Q2FY27 from 66% in Q2FY26, while its reported yield rose by 0.3 percentage points. SME retail’s AUM share declined to 27% from 34% over the same period, while its yield fell by 0.1 percentage points.
CSL Finance calculates both segment yields using the weighted average of outstanding amounts at quarter-end. The disclosed calculation means the 16.8% wholesale yield and 18.1% SME retail yield relate to outstanding portfolios rather than solely to the ₹385 crore of Q2FY27 disbursements.
Conclusion
CSL Finance’s Q2FY27 update shows lending activity and income rising faster than profit. Disbursements reached ₹385 crore, AUM reached ₹1,627 crore and NII rose to ₹49.6 crore, while PAT increased by ₹50 lakh year on year to ₹25 crore. The loan book also became more wholesale-led, with wholesale’s AUM share increasing by 7 percentage points.
The unresolved issue for subsequent disclosures is why 21% growth in NII and total income translated into only 2% year-on-year PAT growth, as the presentation gives no attribution. Readers can also watch whether gross NPA, which rose to 1.13%, net NPA at 0.71%, and the 110% provision coverage ratio change after the disclosed ECL provisioning-policy revision.