










CSL Finance Sets Wholesale Limit as Capital Adequacy Reaches 43%
Key highlights
- CSL Finance set a 1.5–2x leverage threshold for wholesale lending and a below-4x threshold for SME retail.
- CSL Finance's capital adequacy ratio declined from 65% in FY18 to 43% in FY26.
- CSL Finance's total equity increased from Rs 184 crore in FY18 to Rs 615 crore in FY26.
- CSL Finance reported 121 active wholesale accounts and a 36% average LTV in Q2FY27.
powered by IRIS
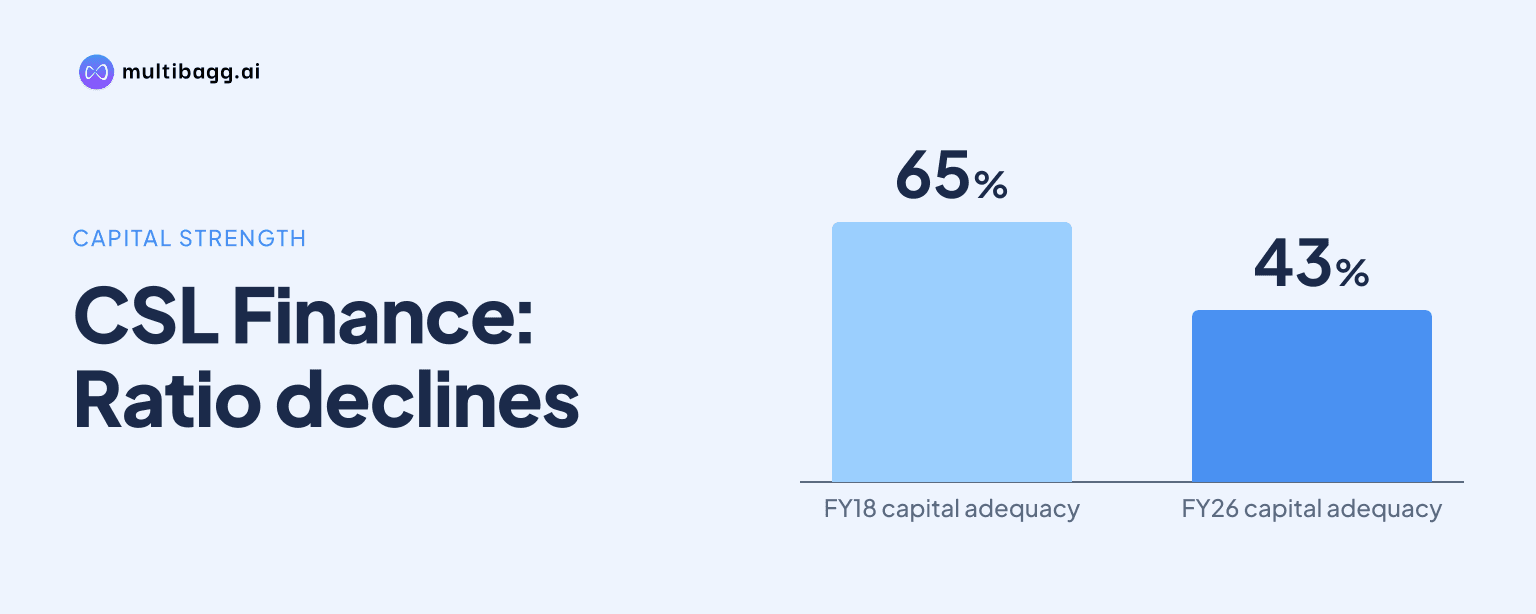
CSL Finance Limited set a 1.5–2x leverage threshold for wholesale lending as its capital adequacy ratio reached 43% in FY26, down from 65% in FY18. Total equity rose from Rs 184 crore to Rs 615 crore over the same period, while the reported company-level leverage ratio increased to 1.39x.
Know CSL Finance inside out
Results, valuation, peers and who's buying, in one view.
What leverage limits has CSL Finance set for its lending businesses?
CSL Finance has set a 1.5–2x leverage threshold for wholesale lending and a threshold below 4x for small and medium enterprise, or SME, retail lending. The presentation describes these as conservative leverage standards and identifies headroom for leverage among the factors supporting its growth plans. The disclosed limits are set by business vertical rather than as a single company-wide target.
The wholesale business is a secured lending book, which CSL Finance says is 100% secured, and it focuses on a niche real-estate wholesale portfolio in the National Capital Region, or NCR. Its underwriting framework includes at least 2x security cover with charges on multiple assets, and the company says it primarily provides last-mile funding. Those product and collateral features form the context for the wholesale leverage threshold.
How have CSL Finance's equity, leverage and capital adequacy changed?
CSL Finance's total equity increased by Rs 431 crore between FY18 and FY26, rising from Rs 184 crore to Rs 615 crore, while its leverage ratio rose from 0.56x to 1.39x. Over the same period, capital adequacy declined by 22 percentage points, from 65% to 43%. The presentation does not report a separate wholesale-segment leverage ratio, so its company-level ratio cannot be treated as the wholesale ratio.
The trend was not uniform in every year. Capital adequacy increased from 65% in FY18 to 79% in FY21, before declining to 64% in FY22, 50% in FY23, 51% in FY24, 47% in FY25 and 43% in FY26. Leverage fell to 0.32x in FY21 from 0.56x in FY18, then rose to 1.13x in FY23 and 1.39x by FY26, even as total equity increased throughout the reported period.
What equity fund raising has CSL Finance disclosed?
CSL Finance discloses equity fund raises of Rs 54 crore in FY18, Rs 30 crore in FY22 and Rs 48 crore in FY24. The three disclosed raises total Rs 132 crore, alongside an increase in total equity from Rs 184 crore in FY18 to Rs 615 crore in FY26. The presentation does not break down the remaining movement in equity into retained earnings or other components.
The Rs 48 crore FY24 equity raise was followed by total equity of Rs 542 crore in FY25, up from Rs 473 crore in FY24, and then Rs 615 crore in FY26. Over those two years, the leverage ratio increased from 1.06x in FY24 to 1.28x in FY25 and 1.39x in FY26. Capital adequacy moved in the other direction, declining from 51% in FY24 to 47% and then 43%.
Got a follow-up? Ask IRIS
What does CSL Finance report on asset-liability management?
CSL Finance reports a positive cumulative inflow-over-outflow position in every maturity bucket through three to five years, with the cumulative position reaching Rs 499 crore in that bucket. Asset-liability management, or ALM, is presented alongside leverage standards in its framework for building for tomorrow. The maturity table reports cumulative inflows and outflows rather than a balance-sheet leverage measure.
The largest stated cumulative surplus is Rs 499 crore in the three-to-five-years bucket, following Rs 247 crore of inflows and Rs 35 crore of outflows in that bucket. In the over-five-years bucket, Rs 148 crore of inflows are set against Rs 647 crore of outflows, a Rs 499 crore net outflow. That net outflow offsets the preceding cumulative Rs 499 crore position, leaving the reported cumulative figure at zero.
What are CSL Finance's current wholesale lending markers?
CSL Finance reported 121 active wholesale accounts in Q2FY27, compared with 114 in Q2FY26 and 110 in Q1FY27. Average loan-to-value, or LTV, was 36% in Q2FY27, matching Q2FY26 after declining to 34% in Q1FY27. The presentation does not provide an outstanding wholesale loan balance.
Average wholesale ticket size was Rs 12 crore in Q2FY27, compared with Rs 13 crore in Q2FY26, Rs 16 crore in Q3FY26 and Rs 11 crore in Q1FY27. Average tenure was three years in every reported quarter from Q2FY26 through Q2FY27. CSL Finance says monitoring includes fortnightly site visits and reviews of sales, inventories, market prices and costs, with early legal action where required.
Conclusion
CSL Finance has disclosed a segmented leverage framework, comprising a 1.5–2x wholesale threshold and a below-4x SME retail threshold, while its company-level leverage ratio reached 1.39x in FY26. The longer comparison shows equity increasing by Rs 431 crore from FY18 to FY26 alongside a 22-percentage-point decline in capital adequacy from 65% to 43%.
The next items to watch are whether CSL Finance uses its stated leverage headroom to support SME self-sufficiency, new products or broader growth, and how those plans affect subsequent leverage and capital adequacy figures. In wholesale, future quarterly disclosures can be assessed against Q2FY27 markers of 121 active accounts, 36% average LTV and a Rs 12 crore average ticket size.