










CSL Finance gross NPA reaches 1.13% as Stage 3 hits ₹17.84 crore
Key highlights
- CSL Finance’s gross NPA ratio rose to 1.13% in Q2FY27 from 0.51% in Q2FY26.
- CSL Finance’s gross Stage 3 assets reached ₹17.84 crore, up from ₹13.92 crore in Q1FY27.
- CSL Finance’s reported PCR declined to 110.29% from 229.06% a year earlier.
- CSL Finance’s total ECL provisions were ₹19.67 crore, or 1.25% of total assets, in Q2FY27.
powered by IRIS
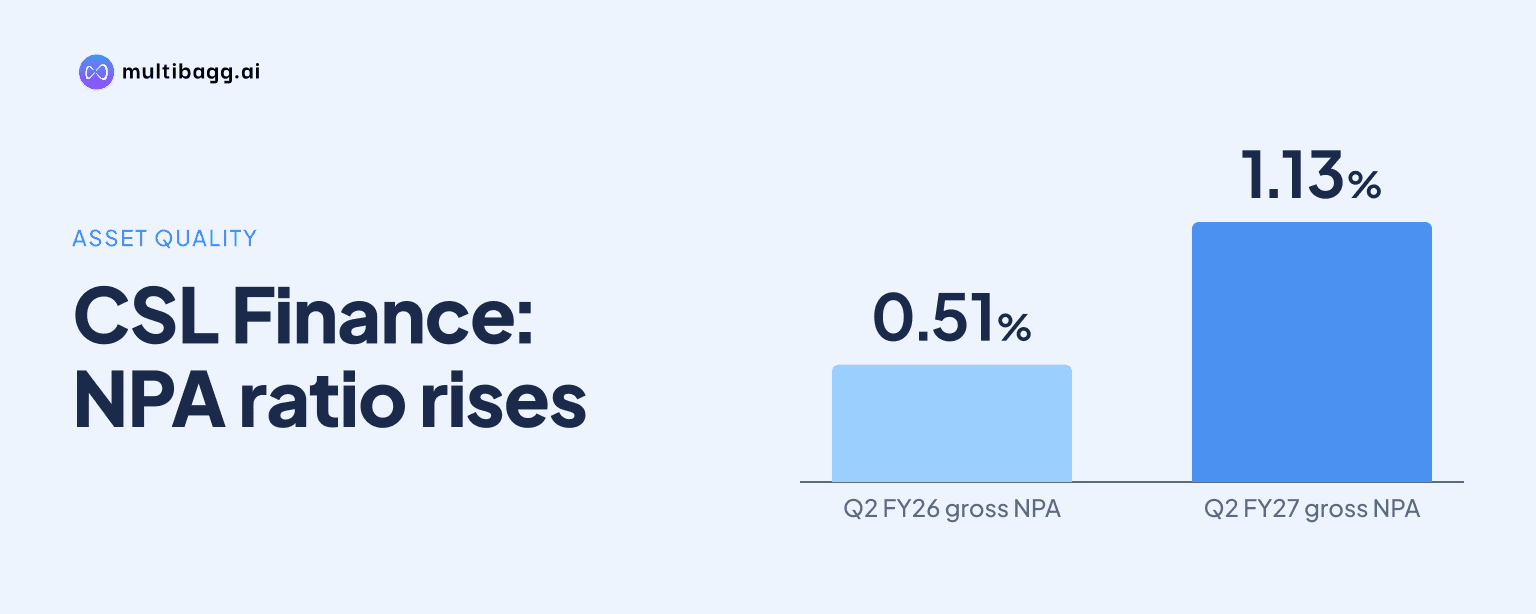
CSL Finance Limited reported a 1.13% gross non-performing asset, or NPA, ratio in Q2FY27, as gross Stage 3 assets reached ₹17.84 crore, up from ₹6.58 crore in Q2FY26. Net NPA rose to 0.71%, while the reported provision coverage ratio, or PCR, declined to 110.29% from 229.06% a year earlier.
Know CSL Finance inside out
Results, valuation, peers and who's buying, in one view.
How did CSL Finance’s asset quality change in Q2FY27?
CSL Finance’s gross NPA ratio rose by 62 basis points year on year and 18 basis points quarter on quarter to 1.13% in Q2FY27. The ratio was 0.51% in Q2FY26, increased to 1.00% in Q3FY26 and 1.10% in Q4FY26, then declined to 0.95% in Q1FY27 before rising again in Q2FY27.
CSL Finance’s net NPA ratio reached 0.71% in Q2FY27, compared with 0.39% in Q2FY26 and 0.60% in Q1FY27. The company reported 99% collection efficiency in Q2FY27, versus 98% in each quarter from Q2FY26 through Q1FY27, while both gross and net NPA ratios increased.
CSL Finance presents its Stage 3 data under the expected credit loss, or ECL, framework prescribed by Indian Accounting Standards, or Ind-AS. The presentation also notes a change in ECL provisioning policy in line with changes suggested by the Reserve Bank of India, but does not quantify the effect of that change on provisions or asset-quality ratios.
What does CSL Finance’s Stage 3 analysis show?
CSL Finance’s gross Stage 3 assets increased to ₹17.84 crore in Q2FY27 from ₹13.92 crore in Q1FY27 and ₹6.58 crore in Q2FY26. Stage 3 represented 1.13% of the portfolio at Q2FY27, against 0.95% a quarter earlier and 0.51% a year earlier. The gross Stage 3 balance rose by ₹3.92 crore sequentially and ₹11.26 crore year on year.
CSL Finance’s Stage 3 ECL provision was ₹6.70 crore in Q2FY27, up from ₹5.12 crore in Q1FY27 and ₹1.54 crore in Q2FY26. The Stage 3 provision rate increased to 37.57% from 36.77% sequentially and 23.35% a year earlier, leaving net Stage 3 assets of ₹11.13 crore, compared with ₹8.80 crore and ₹5.04 crore, respectively.
The majority of CSL Finance’s portfolio remained in Stage 1 and Stage 2, at ₹1,554.58 crore gross, or 98.87% of the portfolio, in Q2FY27. Gross Stage 1 and Stage 2 assets were ₹1,453.83 crore in Q1FY27 and ₹1,281 crore in Q2FY26, but their portfolio share declined from 99.05% sequentially and 99.49% year on year as Stage 3 grew faster.
Got a follow-up? Ask IRIS
How much provisioning supports CSL Finance’s loan book?
CSL Finance reported total ECL provisions of ₹19.67 crore in Q2FY27, equal to 1.25% of total assets of ₹1,572.42 crore. Total ECL provisions were ₹17.15 crore, or 1.17% of total assets, in Q1FY27 and ₹15.07 crore, also 1.17%, in Q2FY26. Total assets increased by ₹104.67 crore sequentially and ₹284.84 crore year on year.
CSL Finance’s reported PCR declined to 110.29% in Q2FY27 from 123.20% in Q1FY27 and 229.06% in Q2FY26. The quarterly asset-quality summary shows rounded PCR figures of 110%, 123% and 229% for the same periods. This measure moved lower even as the Stage 3 ECL provision rate rose to 37.57% from 23.35% a year earlier.
For Stage 1 and Stage 2 accounts, CSL Finance recorded ECL provisions of ₹12.97 crore in Q2FY27, compared with ₹12.03 crore in Q1FY27 and ₹13.53 crore in Q2FY26. The provision rate for these stages was 0.83% in Q2FY27, unchanged from Q1FY27 but below 1.06% in Q2FY26; net Stage 1 and Stage 2 assets were ₹1,541.61 crore.
How did loan growth and recoveries compare with asset quality?
CSL Finance’s assets under management, or AUM, were ₹1,627 crore in Q2FY27, up 16% from ₹1,397 crore in Q2FY26. On-book AUM increased to ₹1,578 crore from ₹1,309 crore, while off-book AUM declined to ₹50 crore from ₹88 crore. Gross loans and advances before ECL provision were ₹1,572.42 crore, compared with ₹1,467.75 crore in Q1FY27.
CSL Finance disbursed ₹384.99 crore in Q2FY27, up from ₹320.80 crore in Q1FY27 and ₹293.40 crore in Q2FY26. Collections were ₹298 crore, compared with ₹283 crore sequentially and ₹256 crore a year earlier. The sequential rise in disbursements of ₹64.19 crore exceeded the ₹15 crore increase in collections.
CSL Finance wrote off ₹2.05 crore of bad debts in Q2FY27 and recovered ₹1.44 crore. Write-offs declined from ₹2.87 crore in Q1FY27 but exceeded ₹1.30 crore in Q2FY26; recoveries increased from ₹1.28 crore sequentially but remained below ₹1.98 crore a year earlier.
Conclusion
CSL Finance combined 16% year-on-year AUM growth with a higher Stage 3 balance in Q2FY27. Gross NPA reached 1.13% and net NPA 0.71%, while gross Stage 3 assets rose to ₹17.84 crore. Although Stage 1 and Stage 2 still comprised 98.87% of the portfolio, PCR declined to 110.29% and the Stage 3 share increased from 0.51% a year earlier.
The next reported asset-quality update will show whether gross Stage 3 assets move from ₹17.84 crore and whether PCR changes from 110.29% as the loan book expands. A further unresolved matter is the effect of the ECL policy change noted by CSL Finance, because the presentation says it aligns with Reserve Bank of India suggestions but does not quantify its impact.