










Danish Power Limited H1 FY27 revenue rises 38% to Rs 291.93 crore
Key highlights
- Danish reported H1 FY27 revenue from operations of Rs 291.93 crore, up 38% year on year.
- Danish’s H1 FY27 EBITDA rose 49% to Rs 55.73 crore and margin increased 140 basis points to 19.1%.
- Danish reported H1 FY27 PAT of Rs 37.72 crore, up 32%, while PAT margin declined 50 basis points to 12.9%.
- Danish reported total assets of Rs 677.66 crore in H1 FY27, compared with Rs 554.49 crore at FY26.
powered by IRIS
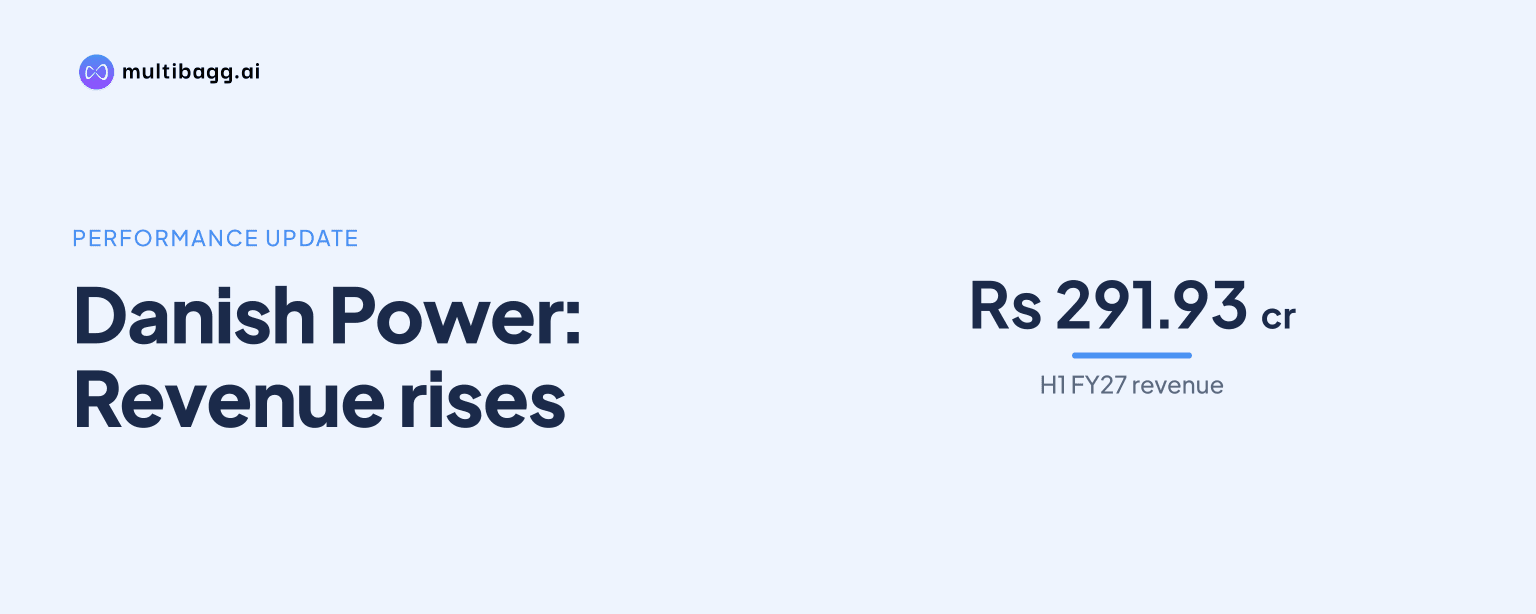
Danish Power Limited reported H1 FY27 revenue from operations of Rs 291.93 crore, up 38% year on year, while earnings before interest, tax, depreciation and amortisation (EBITDA) rose 49% to Rs 55.73 crore and margin improved to 19.1%. Profit after tax (PAT) increased 32% to Rs 37.72 crore, although PAT margin declined 50 basis points to 12.9%.
Know Danish Power inside out
Results, valuation, peers and who's buying, in one view.
How did Danish’s H1 FY27 revenue and EBITDA change?
Danish increased H1 FY27 revenue from operations by 38% to Rs 291.93 crore from Rs 211.61 crore in H1 FY26, while EBITDA rose 49% to Rs 55.73 crore from Rs 37.30 crore. EBITDA therefore increased by Rs 18.43 crore, compared with a Rs 80.32 crore increase in revenue.
Danish’s EBITDA margin increased by 140 basis points to 19.1% in H1 FY27 from 17.7% in H1 FY26. A basis point is one-hundredth of a percentage point. The H1 FY27 margin was also above FY26’s 17.7%, but remained below the 19.4% reported for FY25.
Danish reported FY26 revenue of Rs 521.45 crore, up 22% from Rs 426.71 crore in FY25. EBITDA rose to Rs 92.44 crore in FY26 from Rs 82.96 crore in FY25, while the reported EBITDA margin declined by 170 basis points from 19.4% to 17.7%.
What drove Danish’s H1 FY27 operating-margin movement?
Danish reported operating expenses of Rs 236.20 crore in H1 FY27, up 36% from Rs 174.31 crore in H1 FY26. The expense increase of Rs 61.89 crore was lower than the Rs 80.32 crore rise in revenue from operations, coinciding with EBITDA growth of 49%.
Danish’s 19.1% EBITDA margin reflects the difference between the 38% revenue growth rate and the 36% operating-expense growth rate. The presentation does not provide a breakdown of operating expenses into material, employee, manufacturing or other cost categories, so it does not identify a specific driver of the margin change.
Below EBITDA, depreciation rose to Rs 6.23 crore in H1 FY27 from Rs 2.60 crore a year earlier, and finance cost increased to Rs 1.93 crore from Rs 0.86 crore. Other income declined 18% to Rs 3.84 crore from Rs 4.72 crore, according to the consolidated income statement.
Did Danish’s net profit keep pace with EBITDA growth?
Danish’s PAT rose 32% to Rs 37.72 crore in H1 FY27 from Rs 28.49 crore in H1 FY26, trailing the 49% increase in EBITDA. Profit before tax increased 33% to Rs 51.41 crore from Rs 38.55 crore, while tax expense rose 36% to Rs 13.69 crore from Rs 10.06 crore.
Danish reported a H1 FY27 PAT margin of 12.9%, down 50 basis points from 13.4% in H1 FY26 in the detailed consolidated income statement. The financial-highlights page instead shows a 13.7% H1 FY26 PAT margin, but the detailed statement explicitly presents the year-on-year change as negative 50 basis points.
Danish’s diluted earnings per share rose 30% to Rs 38.30 in H1 FY27 from Rs 28.94 in H1 FY26. For the full years shown, PAT was Rs 54.64 crore in FY25 and Rs 68.98 crore in FY26, while PAT margins in the detailed statement were 12.8% and 13.2%, respectively.
Got a follow-up? Ask IRIS
What does Danish’s H1 FY27 balance sheet show?
Danish reported total assets of Rs 677.66 crore in H1 FY27, compared with Rs 554.49 crore at FY26 and Rs 470.76 crore at FY25. Shareholders’ funds were Rs 494.80 crore in H1 FY27, up from Rs 461.41 crore at FY26, while total current assets rose to Rs 435.06 crore from Rs 319.54 crore.
Danish’s inventories increased to Rs 192.84 crore in H1 FY27 from Rs 91.39 crore at FY26, and trade receivables rose to Rs 129.17 crore from Rs 111.16 crore. Cash and cash equivalents declined to Rs 67.25 crore from Rs 91.83 crore, while other financial assets increased to Rs 45.80 crore from Rs 25.16 crore.
On the liabilities side, Danish reported trade payables of Rs 84.00 crore in H1 FY27, versus Rs 40.61 crore at FY26, and other financial liabilities of Rs 66.18 crore, versus Rs 32.67 crore. Long-term borrowings increased to Rs 11.28 crore from Rs 0.55 crore, while current borrowings rose to Rs 3.70 crore from Rs 1.62 crore.
Danish states that it transitioned from Generally Accepted Accounting Standards to Indian Accounting Standards, or Ind AS, during FY27. It says figures reported through FY26 are not directly comparable with H1 FY27 because of the change in accounting framework, which affects comparisons across those periods.
Conclusion
Danish’s H1 FY27 results show EBITDA growing faster than revenue, with revenue up 38%, EBITDA up 49% and EBITDA margin rising to 19.1%. PAT also increased to Rs 37.72 crore, but its 32% growth rate was lower than EBITDA growth and PAT margin fell to 12.9% under the detailed income-statement comparison.
What to watch next is the comparability of financial reporting following the FY27 transition to Ind AS, which Danish says limits direct comparison with figures through FY26. The presentation also lists an order book of more than 600 in August 2026 and September 2026, with 85% of orders from private players and 20% from international customers, although it gives no monetary value or delivery schedule.