










De Neers Tools Revenue Rises 51.2% in H1 FY27, Margin Falls
Key highlights
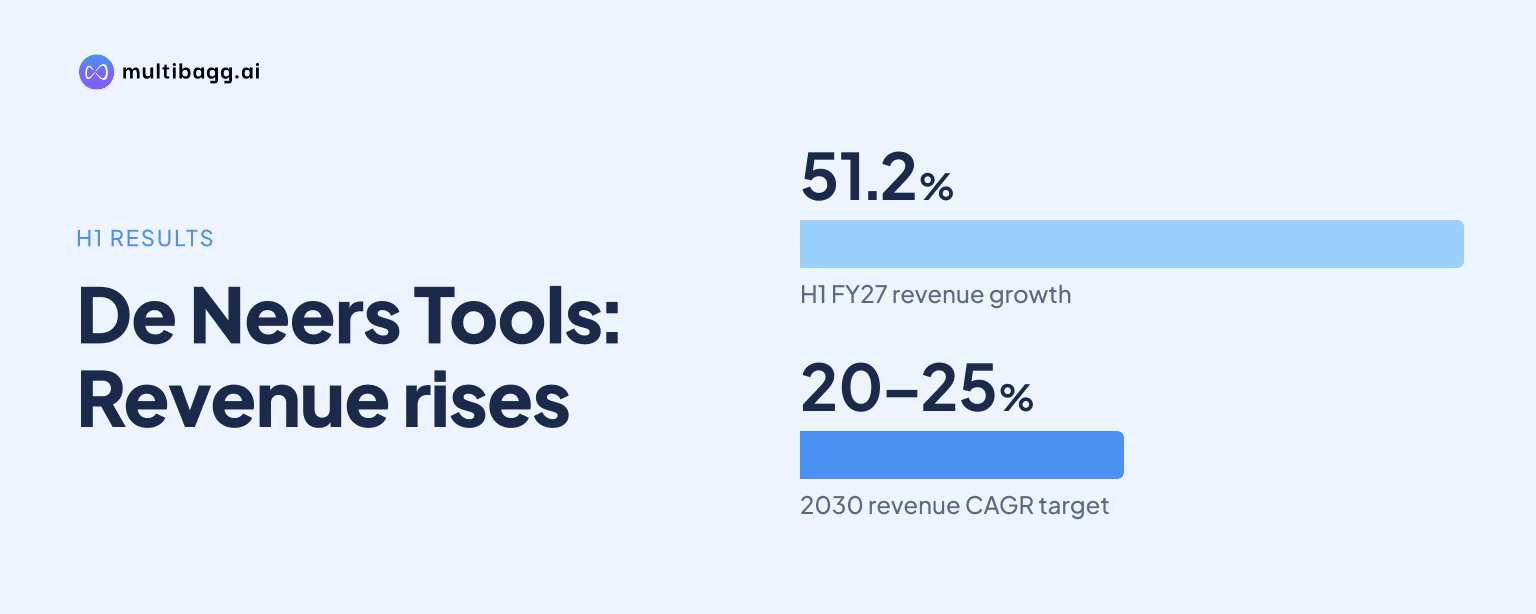
- De Neers Tools reported H1 FY27 consolidated revenue of ₹109.4 crore, up 51.2% year on year.
- EBITDA rose 33.1% to ₹19.5 crore, while EBITDA margin declined 242 basis points to 17.8%.
- PAT increased 43.9% to ₹12.7 crore and PAT margin stood at 11.6%.
- De Neers Tools targets 20% to 25% revenue CAGR and 10% to 15% export share by 2030.
powered by IRIS
De Neers Tools Limited reported consolidated revenue of ₹109.4 crore for H1 FY27, up 51.2% year on year, while its EBITDA margin declined 242 basis points to 17.8% as strategic pricing affected profitability. The company reported EBITDA of ₹19.5 crore and profit after tax of ₹12.7 crore for the half year ended September 2026.
Know De Neers Tools inside out
Results, valuation, peers and who's buying, in one view.
What did De Neers Tools report for H1 FY27?
De Neers Tools reported strong growth in consolidated revenue, EBITDA and profit after tax during H1 FY27. Revenue from operations rose to ₹109.4 crore from the comparable period a year earlier, while EBITDA increased 33.1% to ₹19.5 crore. PAT grew 43.9% to ₹12.7 crore.
The results were approved by the board on November 13, 2026, along with the unaudited standalone and consolidated financial results for the half year ended September 30, 2026. The company filed the results and its investor presentation with the NSE under its DENEERS trading code.
The presentation places the growth alongside a lower operating margin. EBITDA margin stood at 17.8% in H1 FY27, down 242 basis points year on year. PAT margin was 11.6%, down 59 basis points, according to the presentation.
Why did De Neers Tools' EBITDA margin decline?
De Neers Tools attributed the margin dilution to strategic pricing adjustments and the onboarding of leading brands and large orders. Revenue expanded faster than EBITDA, which resulted in the reported reduction in EBITDA margin despite the rise in absolute operating profit.
The company said it expects margin recovery through revised pricing, but did not quantify the expected improvement or specify a timeframe in the presentation. Therefore, the filing establishes the direction of management's expectation but does not provide a formal margin target for investors to measure.
The margin movement is important because it shows that higher sales have not translated proportionately into operating profitability during the reported half year. The presentation links this to commercial decisions intended to support business wins rather than to a disclosed change in revenue recognition or accounting policy.
How does the first-quarter update support the half-year performance?
De Neers Tools had earlier reported consolidated revenue of ₹46.8 crore in Q1 FY27, up 27.8% year on year from ₹36.7 crore. The company described those first-quarter figures as provisional and unaudited when it issued its business update in July 2026.
Standalone revenue in Q1 FY27 was ₹44.8 crore, up 23.9% year on year. Its Dubai subsidiary, De Neers Tools LLC, recorded revenue of ₹2.0 crore during the quarter, compared with ₹0.5 crore in Q1 FY26.
The H1 result of ₹109.4 crore indicates that the company maintained revenue momentum across the first six months of FY27. However, the investor presentation does not provide a separate Q2 revenue, EBITDA or PAT breakdown in the supplied disclosure, so the half-year figures remain the relevant reported measure for assessing current performance.
Got a follow-up? Ask IRIS
What are De Neers Tools' Vision 2030 plans?
De Neers Tools has set a Vision 2030 objective of delivering revenue growth at a 20% to 25% compound annual rate. It also aims to increase exports to 10% to 15% of revenue by 2030, establishing international business as a stated part of its longer-term plan.
The company also disclosed that production at its Sonepat socket-making joint venture is targeted for the middle of FY2027-28. The presentation connects the joint venture and revised pricing initiatives with its objective of improving margins, though it does not disclose project investment, production capacity or expected financial contribution.
For investors, the disclosed plans provide reference points rather than near-term financial guidance. The 20% to 25% growth ambition is a long-term target, while the export share and Sonepat production timeline are operational milestones that can be monitored through subsequent company disclosures.
What does the result mean for investors and operations?
The results show that De Neers Tools expanded revenue and PAT at a double-digit pace in H1 FY27, while operating margin weakened. This makes pricing execution a key disclosed factor in evaluating the quality of future growth, especially because the company has not quantified the anticipated margin recovery.
The filing also indicates that brand onboarding and large orders formed part of the commercial backdrop for the period. For customers and industry participants, the reported strategy suggests De Neers Tools is using pricing and order wins to build volumes. The presentation does not disclose customer-wise sales, order values for H1 FY27, or the financial terms of these arrangements.
The company had separately highlighted a major supply order from Polycab India Limited for 35,000 electrician tool kits in its Q1 FY27 business update. That update demonstrates activity in its professional tools portfolio, but the supplied H1 presentation does not state the contribution of that order to half-year revenue or profitability.
Conclusion
De Neers Tools delivered H1 FY27 consolidated revenue growth of 51.2%, with EBITDA and PAT also rising, but margins declined as strategic pricing affected the operating mix. The key financial takeaway is that profit growth remained positive even as EBITDA margin fell to 17.8%.
Investors will watch for evidence of the company's stated pricing-led margin recovery, progress toward mid-FY2027-28 production at the Sonepat joint venture, and disclosures on the Vision 2030 goals of 20% to 25% revenue CAGR and a 10% to 15% export revenue share.