










Electronics Mart India Limited H1 EBITDA rises 93% on margins
Key highlights
- EMIL reported H1 FY27 revenue of Rs 4,319 crore, up 30% year on year.
- H1 FY27 EBITDA rose 93% to Rs 369 crore and EBITDA margin increased 280 basis points to 8.6%.
- H1 FY27 PAT increased 326% to Rs 161 crore, with PAT margin reaching 3.7%.
- Working capital declined to 61 days from 77 days and the network reached 229 stores.
powered by IRIS
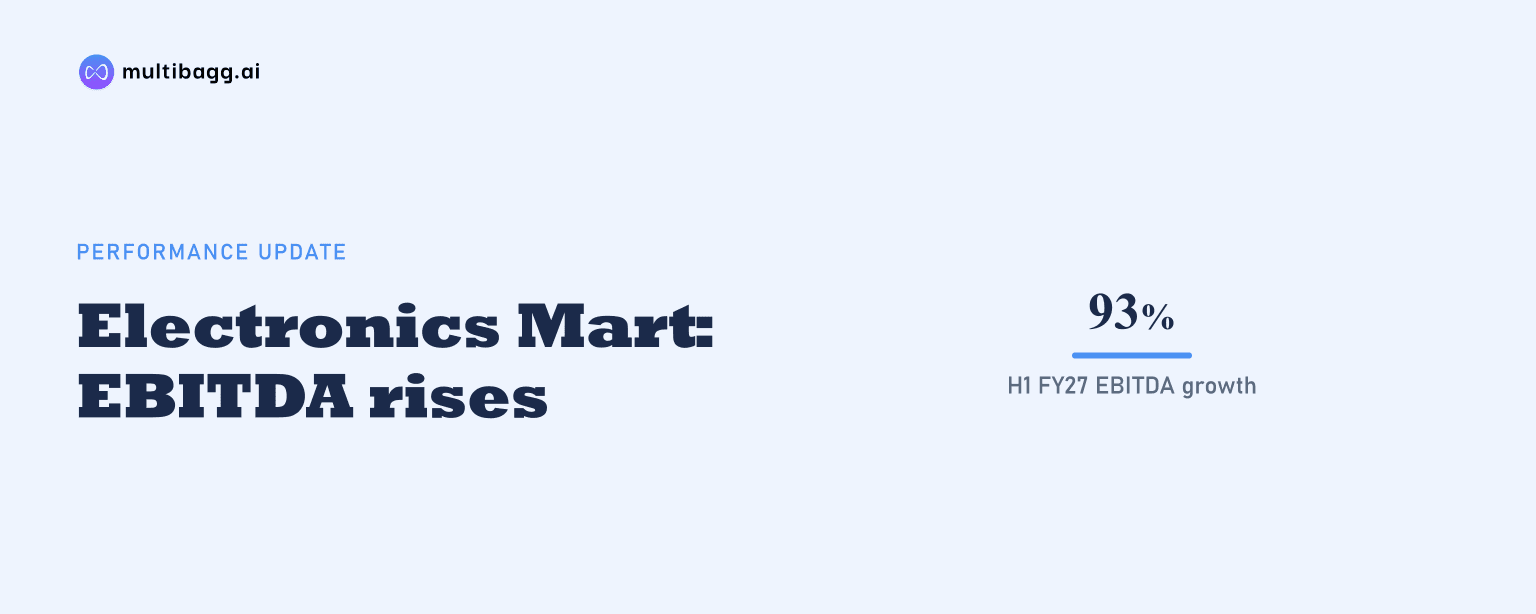
Electronics Mart India Limited reported H1 FY27 EBITDA of Rs 369 crore, up 93% year on year, as EBITDA margin expanded 280 basis points to 8.6% for the half year ended September 30, 2026. EMIL’s revenue rose 30% to Rs 4,319 crore and profit after tax climbed 326% to Rs 161 crore.
Know Electronics Mart India inside out
Results, valuation, peers and who's buying, in one view.
How did EMIL perform in H1 FY27?
EMIL grew EBITDA faster than revenue in H1 FY27, reporting a 93% increase in earnings before interest, tax, depreciation and amortisation, or EBITDA, to Rs 369 crore against 30% revenue growth to Rs 4,319 crore. Gross profit rose 49% to Rs 710 crore, while profit after tax, or PAT, increased 326% to Rs 161 crore during the six months ended September 30, 2026.
The difference between revenue and profit growth coincided with higher reported margins. Gross-profit margin increased 210 basis points, or 2.1 percentage points, to 16.4%, while EBITDA margin rose 280 basis points to 8.6%. PAT margin expanded 260 basis points to 3.7%, compared with the corresponding prior-year half.
EMIL reported same-store sales growth, or SSSG, of 27.5% in H1 FY27. It also recorded Rs 304 crore of pre-Ind AS operating cash flow and reduced working capital to 61 days from 77 days. Six net store additions during the half took the network to 229 stores across more than 100 cities.
What changed in EMIL's Q2 FY27 results?
EMIL reported 19% revenue growth and 61% EBITDA growth in Q2 FY27, with EBITDA reaching Rs 131 crore and margin rising 180 basis points to 6.9%. Revenue from operations was Rs 1,900 crore for the quarter ended September 30, 2026, while gross profit was Rs 293 crore and PAT was Rs 40 crore.
Q2 gross profit increased 31%, exceeding revenue growth, and gross-profit margin rose 130 basis points to 15.4%. PAT increased 149%, while PAT margin expanded 110 basis points to 2.1%. The Q2 EBITDA margin of 6.9% was below the H1 FY27 margin of 8.6%, although both periods showed year-on-year margin expansion.
Management described Q2 as seasonally softer for consumer durables but reported SSSG of 16.5%. It said mobile sales grew 31%, helped by new smartphone launches and demand for existing models, while air-conditioner sales increased 53% despite the off-season. Management also reported a 15% increase in average ticket size and double-digit growth in built-in appliances, dishwashers, tablets and wearables.
Got a follow-up? Ask IRIS
Which regions and categories drove EMIL's sales?
EMIL’s South Cluster revenue grew 28% in H1 FY27 and its EBITDA margin expanded 320 basis points to 9.3%. The North Cluster reported 36% revenue growth and a 3.4% EBITDA margin, up from 1.0% in the prior-year half, representing a 240-basis-point increase.
The Q2 regional pattern was different, with North Cluster revenue growing 45% and South Cluster revenue increasing 16%. South Cluster EBITDA margin rose 220 basis points to 7.4%, while North Cluster EBITDA margin rose 430 basis points year on year to 16%. The release therefore shows faster Q2 revenue growth in North, while South’s reported H1 margin of 9.3% exceeded North’s 3.4%.
Product mix changed between Q2 and the first half. Mobiles represented 53% of Q2 FY27 sales, compared with 45% in H1 FY27, while large appliances accounted for 33% in Q2 and 41% in H1. Small appliances, information technology products and other categories represented 14% of Q2 sales; other categories were also 14% of H1 sales.
Management said more than half of EMIL’s 229-store network is under four years old. It expects margins to improve as stores mature, product mix changes and operating leverage develops; this is management’s expectation rather than a reported financial outcome.
What do cash flow and expansion plans indicate?
EMIL reduced working-capital days by 16 days to 61 in H1 FY27 from 77 days in the comparison period. The company reported Rs 304 crore of pre-Ind AS operating cash flow, but did not disclose the prior-year cash-flow amount, limiting the reported comparison to working-capital days and management’s statement that cash flow grew.
The company operated 229 stores across more than 100 cities in Telangana, Andhra Pradesh and the National Capital Region at the end of H1 FY27. Its portfolio covered more than 8,000 stock-keeping units, or SKUs, across more than 100 domestic and international brands, including mobiles, large appliances, small appliances and information technology products.
Management said EMIL was on track to enter West Bengal as its next growth cluster. It also said festive demand had made a strong start and that it would continue investing in customer experience. The release did not provide a West Bengal entry date, store target, capital-spending figure or expected financial contribution.
Conclusion
EMIL’s H1 FY27 result combined 30% revenue growth with 93% EBITDA growth and 326% PAT growth, alongside a 280-basis-point increase in EBITDA margin to 8.6%. The reported changes also included 27.5% SSSG, a 16-day reduction in working-capital days and six net store additions to a 229-store network.
The next disclosed development to watch is EMIL’s planned entry into West Bengal, for which management has not provided a date or store-count target. Management also expects margins to improve as more than half of its 229 stores, which are under four years old, mature and gain operating leverage.