










Electronics Mart India Limited H1 FY27 profit rises 326%
Key highlights
- EMI's H1 FY27 reported PAT rose 325.8% to Rs 160.8 crore.
- H1 FY27 revenue increased 29.7% to Rs 4,318.7 crore and gross margin rose to 16.4% from 14.3%.
- Reported H1 FY27 EBITDA margin expanded to 8.6% from 5.7%.
- Andhra Pradesh MBO revenue grew 45% to Rs 747 crore in H1 FY27.
powered by IRIS
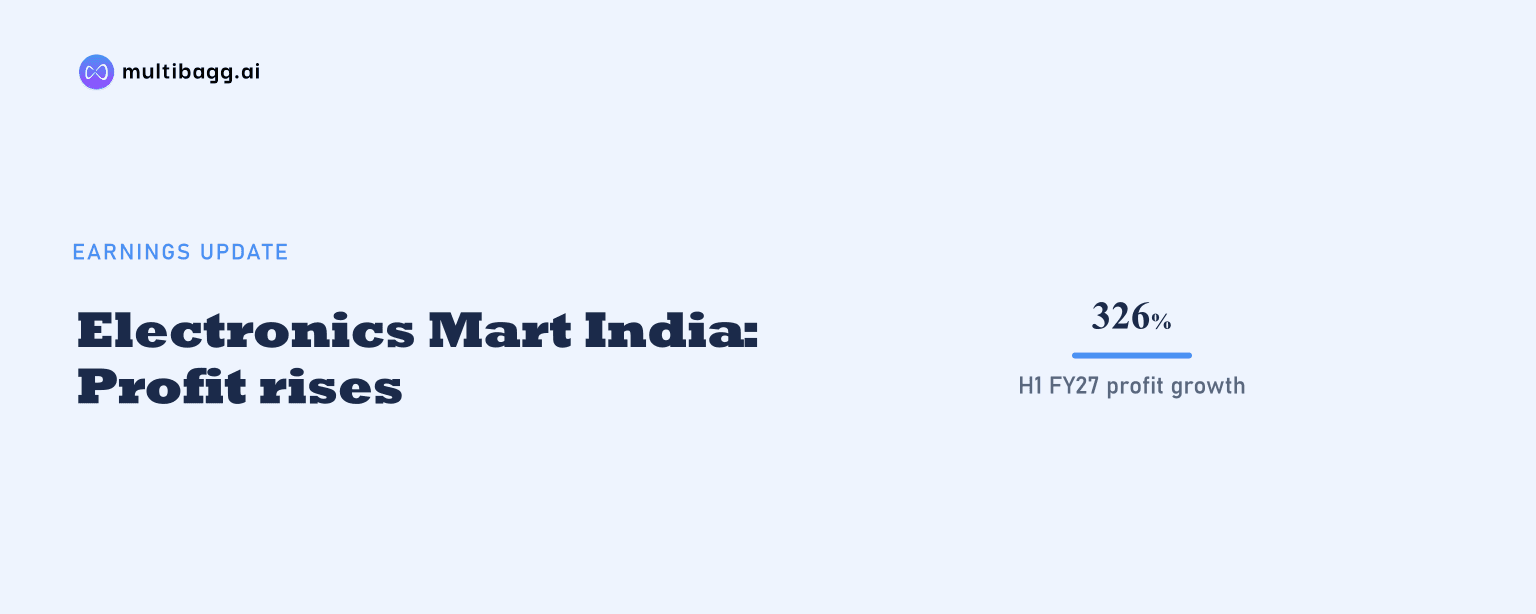
Electronics Mart India Limited reported H1 FY27 profit after tax of Rs 160.8 crore, up 325.8% from Rs 37.8 crore, as revenue rose 29.7% to Rs 4,318.7 crore and reported EBITDA margin expanded to 8.6% from 5.7%. H1 FY26 also included a Rs 7.0 crore exceptional item, while none was disclosed for H1 FY27.
Know Electronics Mart India inside out
Results, valuation, peers and who's buying, in one view.
Why did EMI's H1 FY27 profit rise 325.8%?
EMI's H1 FY27 reported profit after tax, or PAT, rose because gross profit increased faster than revenue and reported operating expenses grew more slowly than gross profit. Gross profit rose 48.8% to Rs 710.0 crore from Rs 477.1 crore, while reported earnings before interest, tax, depreciation and amortisation, or EBITDA, increased 93.4% to Rs 369.5 crore from Rs 191.5 crore. Reported PAT margin consequently increased to 3.7% from 1.5%.
The prior-year comparison includes an exceptional item that needs to be separated from operating profit before exceptional items. EMI's H1 FY26 statement lists a Rs 7.0 crore exceptional item, reported profit before tax of Rs 50.5 crore and profit before tax before exceptional items of Rs 43.5 crore. In H1 FY27, profit before tax before exceptional items and reported profit before tax were both Rs 214.9 crore.
Reported EBITDA margin increased by 2.9 percentage points to 8.6% in H1 FY27 from 5.7% in H1 FY26. The corresponding reported profit before tax rose 325.3% to Rs 214.9 crore from Rs 50.5 crore, while tax increased to Rs 54.1 crore from Rs 12.8 crore.
How did EMI's revenue and margins change in H1 FY27?
EMI increased revenue by Rs 988.3 crore in H1 FY27, while gross margin rose by 2.1 percentage points to 16.4% from 14.3%. Purchases of stock in trade rose to Rs 3,724.6 crore from Rs 2,821.5 crore, and the change in inventory was negative Rs 115.9 crore against a positive Rs 31.8 crore in H1 FY26. These movements resulted in gross profit of Rs 710.0 crore on revenue of Rs 4,318.7 crore.
The operating-margin increase appeared in both the reported and pre-Ind AS 116 presentations. Ind AS 116 is the accounting standard for lease accounting. EMI reported H1 FY27 EBITDA of Rs 369.5 crore, or 8.6% of revenue, while pre-Ind AS 116 EBITDA was Rs 290.0 crore, or 6.7%; the equivalent H1 FY26 figures were Rs 191.5 crore, or 5.7%, and Rs 160.6 crore, or 4.8%.
Employee cost increased to Rs 90.6 crore from Rs 76.5 crore and other expenses rose to Rs 249.9 crore from Rs 209.6 crore. Rent expense was nil in the reported accounts in both periods, but was Rs 79.5 crore in the H1 FY27 pre-Ind AS 116 presentation, compared with Rs 30.4 crore a year earlier. Reported finance cost declined to Rs 73.5 crore from Rs 75.2 crore despite the revenue increase.
Got a follow-up? Ask IRIS
Which EMI markets and store cohorts drove sales?
EMI's Andhra Pradesh cluster delivered the fastest H1 FY27 growth among the four disclosed clusters, with revenue rising 45% to Rs 747 crore and same-store sales growth, or SSSG, of 38.6%. Delhi NCR followed with 36% growth to Rs 372 crore and SSSG of 25.2%. The cluster data covers only multi-brand outlet, or MBO, sales and therefore is not a complete split of reported revenue.
Telangana UP Country grew 33% to Rs 608 crore in H1 FY27, with SSSG of 29.6%, while Telangana Hyderabad City grew 25% to Rs 2,357 crore, with SSSG of 24.8%. Hyderabad City was the largest disclosed cluster, generating Rs 1,610 crore more revenue than Andhra Pradesh. In Q2 FY27, Delhi NCR posted the highest cluster growth rate at 46%, reaching Rs 166 crore from Rs 114 crore.
EMI's store-cohort data shows different operating metrics between older and newer locations. Its 102 mature stores, defined as stores more than four years old, generated retail product sales of Rs 2,975 crore and EBITDA of Rs 289 crore, for a 9.7% margin. Its 127 non-mature stores, defined as under four years old, generated Rs 1,136 crore of sales and Rs 72 crore of EBITDA, for a 6.4% margin.
These cohort figures include exclusive-brand outlets and MBOs, use a pre-Ind AS 116 basis, are net of rent expenses and exclude corporate and warehouse expenses. Management said it expects profitability to improve as more stores mature, generating higher throughput and operating leverage. The mature-store margin was 3.3 percentage points above the non-mature-store margin in the disclosed data.
What do EMI's cash flow and balance sheet show?
EMI generated net cash from operating activities of Rs 383.6 crore in the half year ended September 2026, compared with Rs 279.2 crore in the corresponding prior-year period. Cash generated from operations increased to Rs 426.9 crore from Rs 310.0 crore, while direct taxes paid increased to Rs 43.2 crore from Rs 30.8 crore. The company also presented post-Ind AS 116 cash flow from operations of Rs 384 crore for September 2026, compared with Rs 272 crore for September 2025.
Working-capital days changed over the six months to September 2026. Inventory days fell to 69 from 73 at March 2026 and 77 at September 2025, while receivable days declined to two from three at March 2026. Creditor days rose to 10 from three at March 2026 and four at September 2025, alongside trade payables increasing to Rs 243.4 crore from Rs 66.1 crore.
Cash and cash equivalents stood at Rs 23.9 crore at September 2026, down from Rs 49.7 crore at March 2026, after net investing outflows of Rs 117.7 crore and net financing outflows of Rs 291.7 crore. Total equity increased to Rs 1,787.0 crore from Rs 1,626.1 crore, while current borrowings declined to Rs 516.7 crore from Rs 692.6 crore. Current and non-current lease liabilities together totalled Rs 1,203.5 crore at September 2026.
Conclusion
EMI's H1 FY27 result combined revenue growth of 29.7% with a gross-margin increase from 14.3% to 16.4% and a reported EBITDA-margin increase from 5.7% to 8.6%. The resulting reported PAT increase of 325.8% also needs to be read alongside the Rs 7.0 crore exceptional item in H1 FY26, compared with no disclosed exceptional item in H1 FY27.
The disclosed operating development to watch is whether the 127 non-mature stores move toward the 9.7% EBITDA margin reported for 102 mature stores, versus their current 6.4% margin. Management said profitability is expected to improve as stores mature and generate higher throughput and operating leverage, while inventory days, creditor days and operating cash flow will indicate how that progression develops.