










Electronics Mart India Limited cash falls to Rs 23.9 crore
Key highlights
- EMI generated Rs 383.6 crore of net operating cash in H1 FY27, compared with Rs 279.2 crore in H1 FY26.
- EMI's cash and cash equivalents fell by Rs 25.8 crore to Rs 23.9 crore at Sep-26.
- EMI's inventory days declined to 69 at Sep-26 from 77 at Sep-25, while creditor days rose to 10 from four.
- EMI's total equity increased to Rs 1,787.0 crore at Sep-26 from Rs 1,626.1 crore at Mar-26.
powered by IRIS
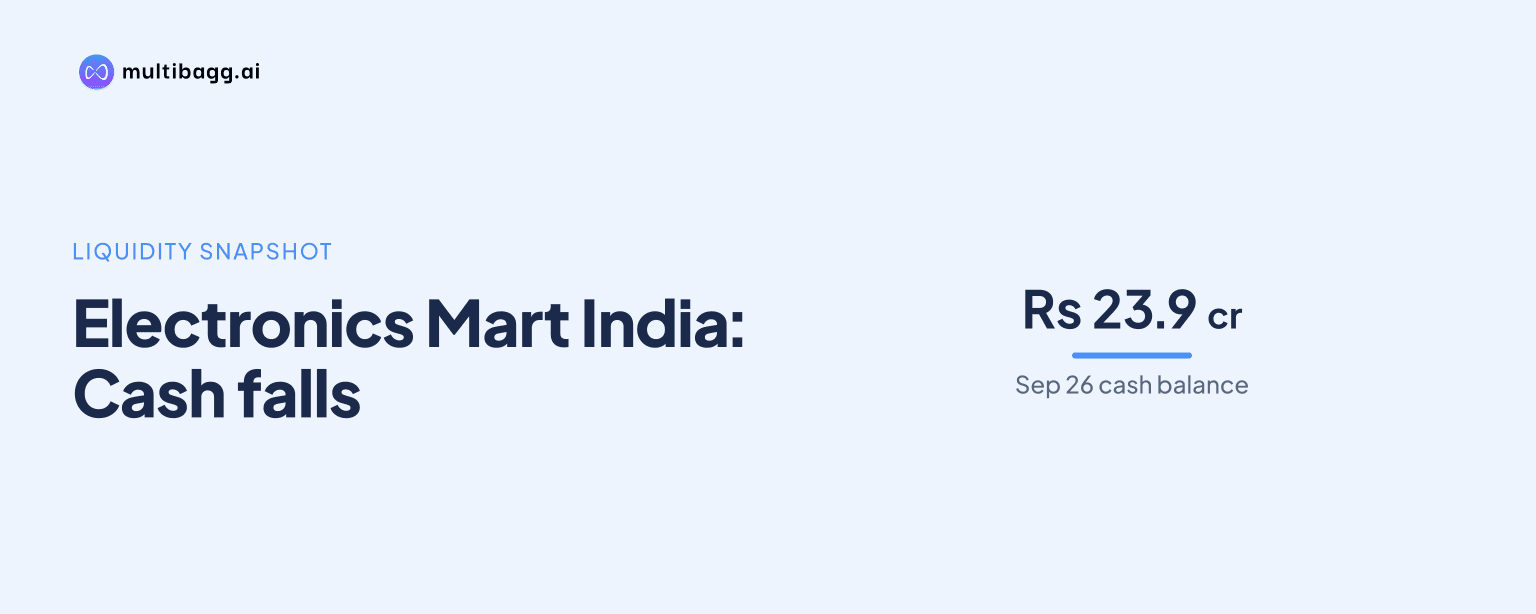
Electronics Mart India Limited generated Rs 383.6 crore of net operating cash in H1 FY27, but investing and financing outflows totalling Rs 409.4 crore reduced cash and cash equivalents to Rs 23.9 crore at Sep-26 from Rs 49.7 crore at the beginning of the period.
Know Electronics Mart India inside out
Results, valuation, peers and who's buying, in one view.
How did EMI generate Rs 383.6 crore of operating cash in H1 FY27?
EMI generated Rs 383.6 crore of net cash from operating activities in H1 FY27, compared with Rs 279.2 crore in H1 FY26. Profit before tax increased to Rs 214.9 crore from Rs 50.5 crore, while non-cash, investment and financial adjustments were Rs 155.8 crore, against Rs 139.1 crore a year earlier. Operating profit before working-capital changes consequently rose to Rs 370.7 crore from Rs 189.6 crore.
Working-capital changes contributed Rs 56.2 crore in H1 FY27, taking cash generated from operations to Rs 426.9 crore. The contribution was below Rs 120.5 crore in H1 FY26, but cash generated from operations still increased from Rs 310.0 crore because of the higher operating profit. Direct taxes paid, net of refund, rose to Rs 43.2 crore from Rs 30.8 crore.
The presentation's rounded post-Ind AS 116 operating-cash measure was Rs 384 crore at Sep-26, compared with Rs 272 crore at Sep-25. On the pre-Ind AS 116 basis, the corresponding figures were Rs 304 crore and Rs 202 crore. The detailed H1 cash-flow statement reports net cash from operating activities of Rs 383.6 crore for Sep-26 and Rs 279.2 crore for Sep-25.
What changed in EMI's working-capital indicators?
EMI's inventory days fell to 69 at Sep-26 from 77 at Sep-25, while receivable days declined to two from four and creditor days increased to 10 from four. Against Mar-26, inventory days decreased from 73 and receivable days from three, while creditor days rose from three. These measures coincided with a Rs 56.2 crore positive change in working capital during H1 FY27.
EMI's Sep-26 inventory balance was Rs 1,356.6 crore, up Rs 115.9 crore from Rs 1,240.7 crore at Mar-26. Trade receivables fell by Rs 9.5 crore to Rs 45.8 crore, while trade payables rose by Rs 177.3 crore to Rs 243.4 crore. The day metrics describe period-end working-capital positions, whereas the cash-flow statement gives the aggregate H1 cash effect.
Why did EMI's cash balance fall despite operating cash generation?
EMI's cash and cash equivalents decreased by Rs 25.8 crore in H1 FY27 because its combined Rs 409.4 crore of investing and financing outflows exceeded its Rs 383.6 crore operating inflow. Net cash used in investing activities was Rs 117.7 crore and net cash used in financing activities was Rs 291.7 crore. Cash therefore moved from Rs 49.7 crore at the beginning of the period to Rs 23.9 crore at Sep-26.
The cash decrease was Rs 20.5 crore larger than the Rs 5.3 crore reduction in H1 FY26. Operating cash rose by Rs 104.4 crore year on year, while investing outflows increased by Rs 21.7 crore and financing outflows increased by Rs 103.2 crore. The additional operating inflow therefore did not fully cover the higher cash use in those two categories.
Got a follow-up? Ask IRIS
What changed in EMI's balance sheet by Sep-26?
EMI's total assets rose to Rs 4,070.2 crore at Sep-26 from Rs 3,797.1 crore at Mar-26, an increase of Rs 273.1 crore. Non-current assets increased by Rs 164.1 crore to Rs 2,281.7 crore, including right-of-use assets of Rs 1,012.7 crore and property, plant and equipment of Rs 1,016.0 crore. Current assets increased by Rs 109.0 crore to Rs 1,788.5 crore.
Total equity increased by Rs 160.9 crore to Rs 1,787.0 crore, as reserves and surplus rose to Rs 1,402.3 crore from Rs 1,241.4 crore; share capital remained Rs 384.7 crore. Non-current liabilities rose to Rs 1,319.5 crore from Rs 1,249.2 crore, while current liabilities increased to Rs 963.7 crore from Rs 921.8 crore.
EMI's non-current borrowings declined to Rs 180.9 crore at Sep-26 from Rs 198.5 crore at Mar-26, and current borrowings fell to Rs 516.7 crore from Rs 692.6 crore. Non-current lease liabilities increased to Rs 1,137.1 crore from Rs 1,048.5 crore, while current lease liabilities rose to Rs 66.4 crore from Rs 57.3 crore. The cash-flow statement does not give a line-by-line breakdown of the Rs 291.7 crore financing outflow.
How does Ind AS 116 affect EMI's H1 FY27 figures?
EMI reported H1 FY27 earnings before interest, tax, depreciation and amortisation, or EBITDA, of Rs 369.5 crore, while pre-Ind AS 116 EBITDA was Rs 290.0 crore. The disclosed Ind AS 116 impact was Rs 79.5 crore, compared with an impact of Rs 30.4 crore in H1 FY26. Reported EBITDA was Rs 191.5 crore in H1 FY26 and pre-Ind AS 116 EBITDA was Rs 160.6 crore.
Reported EBITDA margin was 8.6% in H1 FY27, compared with 6.7% on the pre-Ind AS 116 basis. EMI reported depreciation of Rs 84.9 crore, including a Rs 53.3 crore Ind AS 116 impact, and finance cost of Rs 73.5 crore, including a Rs 51.5 crore impact. At Sep-26, its right-of-use asset was Rs 1,012.7 crore and total lease liabilities were Rs 1,203.5 crore.
Conclusion
EMI's H1 FY27 cash flow combined a Rs 383.6 crore operating inflow with a positive Rs 56.2 crore working-capital contribution, alongside lower inventory and receivable days. However, Rs 117.7 crore of investing outflows and Rs 291.7 crore of financing outflows exceeded operating cash, leaving closing cash at Rs 23.9 crore.
The next disclosed development to watch is EMI's plan to expand into high-potential markets including West Bengal. At Sep-26, EMI operated 229 stores, of which 193 were leased, while right-of-use assets stood at Rs 1,012.7 crore and non-current lease liabilities were Rs 1,137.1 crore.