




Earnings Call/Transcript
Electronics Mart India Q2 FY27 Earnings Call Transcript
Electronics Mart India submitted the transcript of its Q2 and H1 FY27 earnings call held on 5 November 2026.





IRIS
Multibagg AI is an AI powered stock research and analysis platform. We provide data, information, content, and analytics for publicly traded Indian companies listed on NSE and BSE. AI can make mistakes, check important information.
Prices might be delayed by a few minutes.
Join our Exclusive Community


Join our Exclusive Community
Made with 💙 in India. © Finsky Technologies Pvt Ltd. 2026


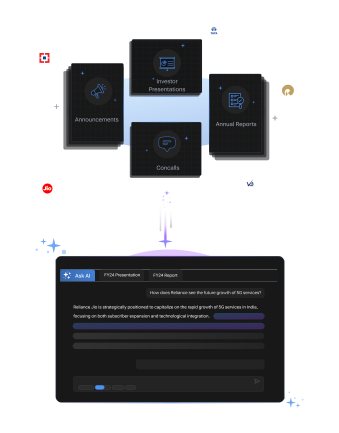
Get instant AI-powered insights about company performance, financials, and strategy. Ask questions about trends, competition, and developments while receiving responses backed by official documents and market data, with clear attribution to source documents.




 Discovery themes featuring this stock
Bearish
3
Neutral
4
Bullish
7
Bearish
33
Neutral
4
Bullish
9
Bearish
30
Neutral
0
Bullish
2
Bearish
30
Neutral
0
Bullish
2
Bearish
30
Neutral
0
Bullish
2
Bearish
30
Neutral
0
Bullish
2
| Symbol | Watchlist | Price | Market Cap | P/E | P/B | Div Yield (%) | ROE (%) | ROCE (%) | ROA (%) |
753.45 | 6,008 Cr | 46.17 | 6.14 | 0.13 | 13.30 | 11.86 | 4.22 | ||
143.95 | 5,519 Cr | 23.98 | 3.09 | 0.00 | 12.88 | 12.46 | 5.66 | ||
362.10 | 4,004 Cr | -352.15 | 14.19 | 0.00 | 1.56 | 7.79 | -0.17 | ||
166.30 | 1,173 Cr | -6898.41 | 19.94 | 0.00 | -0.37 | -0.16 | 0.24 | ||
247.30 | 823 Cr | 19.89 | 2.15 | 0.00 | 10.81 | 12.69 | 6.77 | ||
20.79 | 187 Cr | -0.75 | 0.00 | 0.00 | 24.08 | -6.70 | -18.25 | ||
99.12 | 88 Cr | 15.50 | 9.18 | 0.00 | — | — | 0.00 | ||
| Median: 7 Co. | — | 166.30 | 1,173 Cr | 15.50 | 6.14 | 0.00 | 11.84 | 9.82 | 0.24 |


Electronics Mart India Limited operates consumer electronics retail, wholesale, and e-commerce businesses, selling large appliances, mobile phones, small appliances, information technology products, and related electronics through multi-brand and exclusive-brand stores. Its assortment exceeds 8,000 SKUs sourced from more than 100 consumer durable and electronics brands.
The company delivered an unusually strong first half, with revenue rising 30% to INR4,319 crores, EBITDA increasing 93% to INR369 crores, and profit after tax growing 326% to INR161 crores. This performance reflects both robust demand and significant operating leverage across a rapidly maturing store network.
Electronics Mart India Limited demonstrated category resilience despite a changing product mix. Mobile phones contributed 53% of Q2 product revenue, yet quarterly EBITDA margin expanded 180 basis points to 6.9%, supported by premium positioning, higher average ticket sizes, extended air-conditioner demand, and improved profitability from the northern cluster.
The company’s growth is increasingly diversified geographically. South India remains the profitable core, while the North cluster generated 45% Q2 revenue growth and improved first-half EBITDA margin to 3.4% from 1%. West Bengal represents the next major expansion opportunity, with four to five stores scheduled to begin operations by mid-November.
Management retained its full-year growth and margin objectives despite strong first-half execution, preferring execution certainty over near-term guidance upgrades. The principal potential upside is an early summer, while the key normalization risk is that first-half gross-margin benefits from price inflation and inventory liquidation may not repeat in the second half.
Retailing
Diversified Retail
5,519 Cr
High Risk
24.0
67.2
1.9
3.1
212.70
75.65
Sales CAGR
Profit CAGR
ROE
ROCE



 Discovery themes featuring this stock
Electronics Mart India Ltd (EMIL) is currently trading at 143.95 per share. Stock prices fluctuate during market hours on NSE and BSE based on demand, company updates, and overall market conditions. Refer to the live price chart above for the most recent price movement.
Electronics Mart India Limited operates consumer electronics retail, wholesale, and e-commerce businesses, selling large appliances, mobile phones, small appliances, information technology products, and related electronics through multi-brand and exclusive-brand stores. Its assortment exceeds 8,000 SKUs sourced from more than 100 consumer durable and electronics brands. The company delivered an unusually strong first half, with revenue rising 30% to INR4,319 crores, EBITDA increasing 93% to INR369 crores, and profit after tax growing 326% to INR161 crores. This performance reflects both robust demand and significant operating leverage across a rapidly maturing store network. Electronics Mart India Limited demonstrated category resilience despite a changing product mix. Mobile phones contributed 53% of Q2 product revenue, yet quarterly EBITDA margin expanded 180 basis points to 6.9%, supported by premium positioning, higher average ticket sizes, extended air-conditioner demand, and improved profitability from the northern cluster. The company’s growth is increasingly diversified geographically. South India remains the profitable core, while the North cluster generated 45% Q2 revenue growth and improved first-half EBITDA margin to 3.4% from 1%. West Bengal represents the next major expansion opportunity, with four to five stores scheduled to begin operations by mid-November. Management retained its full-year growth and margin objectives despite strong first-half execution, preferring execution certainty over near-term guidance upgrades. The principal potential upside is an early summer, while the key normalization risk is that first-half gross-margin benefits from price inflation and inventory liquidation may not repeat in the second half.
Over the past 52 weeks, Electronics Mart India Ltd has traded between a low of ₹75.65 and a high of ₹212.70. The 52-week high and low indicate the stock’s price range over the last year and help investors understand its volatility and recent trading levels.
Electronics Mart India Ltd has a market capitalization of approximately 5,519.22. Market capitalization represents the total value of a company’s outstanding shares and helps investors understand its size, stability, and relative risk compared to other listed companies.
Electronics Mart India Ltd’s investment profile depends on its business fundamentals, valuation, and long-term outlook. The stock currently trades at a PE ratio of 23.98 and operates in the its sector sector. Investors typically assess financial performance, growth prospects, and individual risk tolerance before making investment decisions.
Based on its market capitalization of 5,519.22 Cr, Electronics Mart India Ltd is classified as a Small Cap stock. Large-cap stocks are generally more stable, while mid-cap and small-cap stocks tend to offer higher growth potential along with higher price volatility.
Electronics Mart India Ltd operates in the its sector sector. Sector classification matters because companies in the same sector are often affected by similar economic conditions, regulatory changes, and competitive dynamics, which can influence overall stock performance.
The Price-to-Earnings (PE) ratio of Electronics Mart India Ltd is 23.98. The PE ratio compares a company’s share price to its earnings and is commonly used to assess valuation. Comparing the PE ratio with sector peers and historical levels provides better context.
EMIL said it expects to begin West Bengal operations by the second week of November 2026. Management expects four to five Kolkata stores to be operating initially and plans further openings as properties are ready.
EMIL said the North margin rose because stores are maturing and scaling, while H1 FY2027 revenue in the cluster increased 36%. The margin was 1% in the prior-year first half, so the increase was 240 bps. The company did not provide a North store-level cost bridge.
Electronics Mart has guided for about Rs 600 crore of pre-Ind AS operating cash flow in FY27. Management confirmed that the measure excludes Ind AS adjustments.
EMIL reported revenue from operations of ₹4,319 crore in H1 FY27, up 30% year-on-year. Its H1 EBITDA was ₹369 crore and PAT was ₹161 crore.
Earnings Call/Transcript
Electronics Mart India submitted the transcript of its Q2 and H1 FY27 earnings call held on 5 November 2026.
Public Notice/Press Release
Electronics Mart India officials will hold one-to-one meetings with investors and analysts in the UAE on 11 November 2026 from 9:00 a.m. GST.
Financial Results
Electronics Mart India submitted newspaper advertisements for its unaudited standalone and consolidated financial results for Q2 and the first half ended September 30, 2026.
Earnings Call/Transcript
Electronics Mart India submitted the audio recording of its 5 November 2026 earnings call on Q2 and H1 FY27 financial results.
Investor Presentation
Electronics Mart India submitted its investor presentation covering Q2 and H1 FY27 performance, scheduled for 5 November 2026 at 4:00 p.m. IST.
Financial Results
Electronics Mart India reported unaudited Q2 FY27 revenue of Rs. 1,900 crore, up 19% year-on-year, while EBITDA rose 61% and PAT increased 149%.
View Standalone
View Standalone
View Standalone
View Standalone
View Standalone
View Standalone
View Standalone
View Standalone