










Ellenbarrie FY26 profit more than doubles as assets rise
Key highlights
- Ellenbarrie reported FY26 profit of Rs 104.4 crore, compared with Rs 45.3 crore in FY24.
- Total assets increased to Rs 1,299 crore in FY26 from Rs 672.5 crore in FY24.
- FY26 operating cash flow was Rs 132.5 crore, versus Rs 4.3 crore in FY25.
- Shareholder equity reached Rs 977.1 crore in FY26 after Rs 379.8 crore of net equity-share proceeds.
powered by IRIS
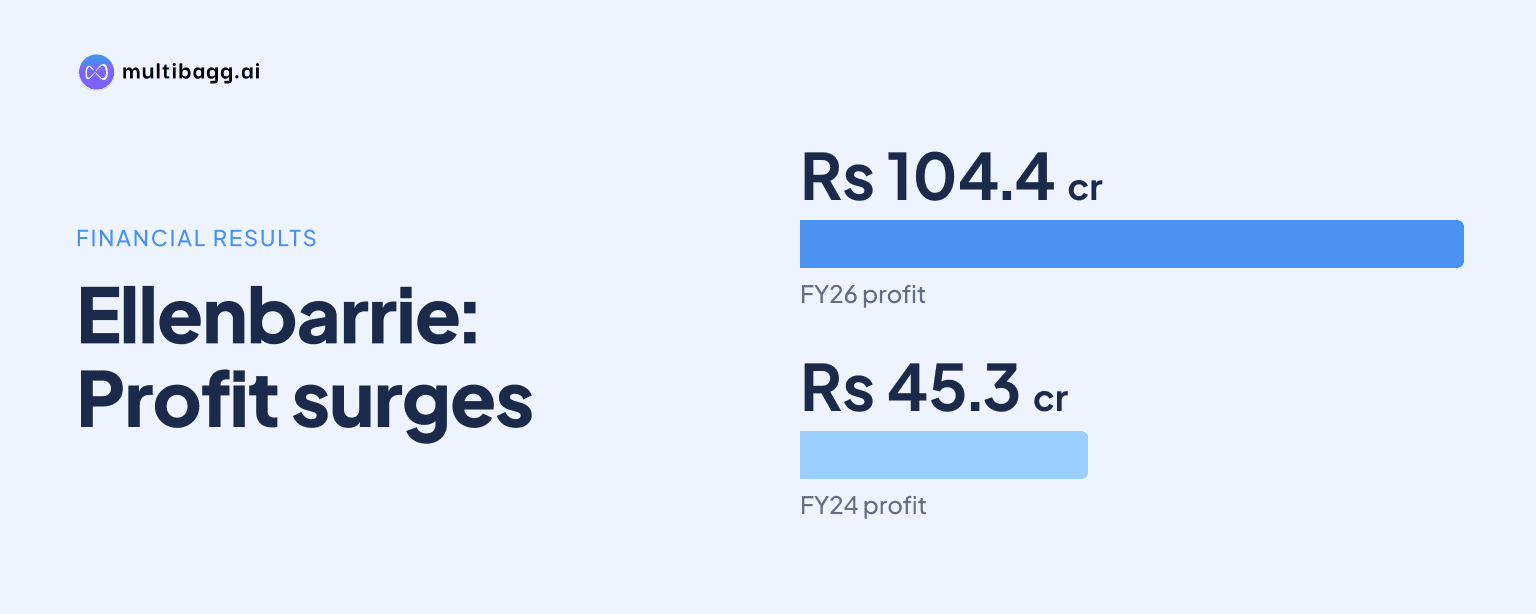
Ellenbarrie Industrial Gases Ltd reported FY26 profit for the year of Rs 104.4 crore, versus Rs 45.3 crore in FY24, as total assets reached Rs 1,299 crore from Rs 672.5 crore. Revenue from operations increased to Rs 341.6 crore, while shareholder equity rose to Rs 977.1 crore.
Know Ellenbarrie Industrial Gases inside out
Results, valuation, peers and who's buying, in one view.
How did Ellenbarrie's profit and income change from FY24 to FY26?
Ellenbarrie's profit for the year increased by Rs 59.1 crore over the two years, reaching Rs 104.4 crore in FY26 after Rs 83.3 crore in FY25 and Rs 45.3 crore in FY24. Profit before tax and exceptional items rose from Rs 64.2 crore in FY24 to Rs 107.8 crore in FY25 and Rs 135.3 crore in FY26. Basic and diluted earnings per share increased from Rs 4 in FY24 to Rs 7.5 in FY26.
Revenue from operations rose to Rs 341.6 crore in FY26 from Rs 312.5 crore in FY25 and Rs 269.5 crore in FY24. Other income increased from Rs 20.7 crore in FY24 to Rs 36 crore in FY25 and Rs 50 crore in FY26, taking total income to Rs 391.6 crore. The Rs 43.2 crore increase in total income during FY26 was lower than the Rs 58.2 crore increase reported during FY25.
Ellenbarrie's cost movements differed by category over the period. Power expenses declined to Rs 73.7 crore in FY26 from Rs 77.7 crore in FY24, while purchases of stock-in-trade fell to Rs 36.2 crore from Rs 53.4 crore. Employee benefits expense rose to Rs 28 crore from Rs 16.1 crore, and depreciation and amortisation increased to Rs 21.5 crore from Rs 10 crore. Finance costs were Rs 9.5 crore in FY26, after Rs 17.1 crore in FY25 and Rs 8 crore in FY24.
What drove Ellenbarrie's larger FY26 asset base?
Ellenbarrie's total assets rose by Rs 626.5 crore from FY24 to Rs 1,299 crore in FY26. Non-current assets accounted for Rs 1,000 crore of the FY26 total, compared with Rs 637 crore in FY25 and Rs 468.6 crore in FY24. Current assets increased to Rs 299 crore from Rs 209 crore in FY25 and Rs 203.9 crore in FY24.
Property, plant and equipment increased to Rs 449 crore in FY26 from Rs 337.6 crore in FY25 and Rs 329.3 crore in FY24. Capital work-in-progress rose to Rs 77.9 crore from Rs 45.3 crore a year earlier and Rs 40 lakh in FY24. Non-current investments reached Rs 314.3 crore in FY26, compared with Rs 107.7 crore in FY25 and Rs 57.9 crore in FY24.
Ellenbarrie's FY26 cash flow statement records Rs 158.4 crore of purchases of property, plant and equipment, including capital work-in-progress. Trade receivables reduced to Rs 63.3 crore in FY26 from Rs 82.6 crore in FY25, but remained above Rs 45.3 crore in FY24. Other bank balances rose to Rs 70.9 crore from Rs 2.8 crore, while current loans increased to Rs 55.5 crore from Rs 4 crore.
How did Ellenbarrie's equity and borrowings change in FY26?
Ellenbarrie's shareholder equity rose to Rs 977.1 crore in FY26 from Rs 493.4 crore in FY25 and Rs 409.9 crore in FY24. The FY26 financing cash flow included Rs 379.8 crore of net proceeds from the issue of equity shares. This equity issuance was disclosed alongside FY26 profit of Rs 104.4 crore.
Total liabilities declined to Rs 321.8 crore in FY26 from Rs 352.6 crore in FY25, although they were above Rs 262.6 crore in FY24. Non-current liabilities fell to Rs 135.1 crore from Rs 204.6 crore a year earlier. Non-current borrowings reduced to Rs 59.4 crore from Rs 146.7 crore, following Rs 215.2 crore of repayments and Rs 140.3 crore of new non-current borrowing proceeds during FY26.
Current borrowings moved in the other direction, rising to Rs 120.7 crore in FY26 from Rs 98.6 crore in FY25 and Rs 81.9 crore in FY24. Total current liabilities increased to Rs 186.7 crore from Rs 148 crore, including Rs 35.4 crore of other financial liabilities compared with Rs 19.9 crore a year earlier. The decline in total liabilities during FY26 therefore came from the non-current portion.
Got a follow-up? Ask IRIS
Did Ellenbarrie's operating cash flow fund FY26 investment?
Ellenbarrie's net cash generated from operating activities was Rs 132.5 crore in FY26, compared with Rs 4.3 crore in FY25 and Rs 43.8 crore in FY24. Cash generated from operations increased to Rs 157 crore from Rs 11.7 crore in FY25, while income tax paid rose to Rs 24.5 crore from Rs 7.4 crore. The improvement followed an increase in profit before tax to Rs 135.3 crore from Rs 107.8 crore.
Ellenbarrie made Rs 283.7 crore of investments and gave Rs 58.5 crore of loans during FY26, in addition to the Rs 158.4 crore plant and equipment expenditure. The presentation reports Rs 436.4 crore as the net cash outflow below the investing-activities section, compared with Rs 56.9 crore in FY25, although that line is labelled “net cash used in financing activities.” Financing activities generated Rs 304.9 crore in FY26, including the Rs 379.8 crore equity-share proceeds.
Cash and cash equivalents ended FY26 at Rs 1.2 crore, compared with Rs 20 lakh at FY25-end and Rs 90 lakh at FY24-end. The FY26 increase of Rs 1 crore followed operating inflow of Rs 132.5 crore, investing outflow of Rs 436.4 crore and financing inflow of Rs 304.9 crore. The figures show that the year’s investment and borrowing repayments occurred alongside a substantial equity inflow.
What changed in Ellenbarrie's FY26 revenue mix?
Ellenbarrie's sale of gases, related products and services represented 98% of FY26 revenue, compared with 94% in FY25 and 84% in FY24. Project engineering consequently represented 2% of FY26 revenue, down from 6% in FY25 and 16% in FY24. This shift occurred as revenue from operations rose by Rs 72.1 crore from FY24 to FY26.
Oxygen accounted for 44% of FY26 revenue, up from 40% in FY25 but below 48% in FY24. Nitrogen represented 37%, returning to its FY24 share after reaching 47% in FY25. Argon increased to 10% from 8% a year earlier, while the others category rose to 9% from 4%.
Steel contributed 33% of FY26 revenue by industry, compared with 37% in FY25 and 29% in FY24. Pharma and chemicals declined to 23% from 28%, while dealer and retail increased to 16% from 10%. Government customers represented 29% of FY26 revenue, up from 27% in FY25 and 21% in FY24, with non-government customers accounting for 71%.
Conclusion
Ellenbarrie's FY24-to-FY26 financial data show that higher income and profit were accompanied by a larger asset base and expanded shareholder equity. Profit rose by Rs 59.1 crore, total assets by Rs 626.5 crore and equity by Rs 567.2 crore, while operating cash flow reached Rs 132.5 crore in FY26. Property, plant and equipment, capital work-in-progress and non-current investments were each higher than in the preceding two years.
The disclosed Rs 77.9 crore of FY26 capital work-in-progress is the key unresolved balance-sheet item to watch next, alongside the operating effect of Rs 158.4 crore of FY26 plant and equipment purchases. Changes in current borrowings, which reached Rs 120.7 crore despite lower non-current borrowings of Rs 59.4 crore, will also indicate how Ellenbarrie finances further asset deployment.