










Ellenbarrie Industrial Gases Ltd reports 86% repeat revenue
Key highlights
- Ellenbarrie reported that repeat customers generated 86% of revenue in FY26, unchanged from FY25.
- Ellenbarrie’s largest customer represented 6.7%, while its top 10 customers represented 38.8%.
- Revenue from customers with relationships exceeding 10 years rose to Rs 127 crore in FY26 from Rs 117.5 crore in FY24.
- Ellenbarrie reported 328 bulk customers and 1,498 packaged customers as of 31 March 2026.
powered by IRIS
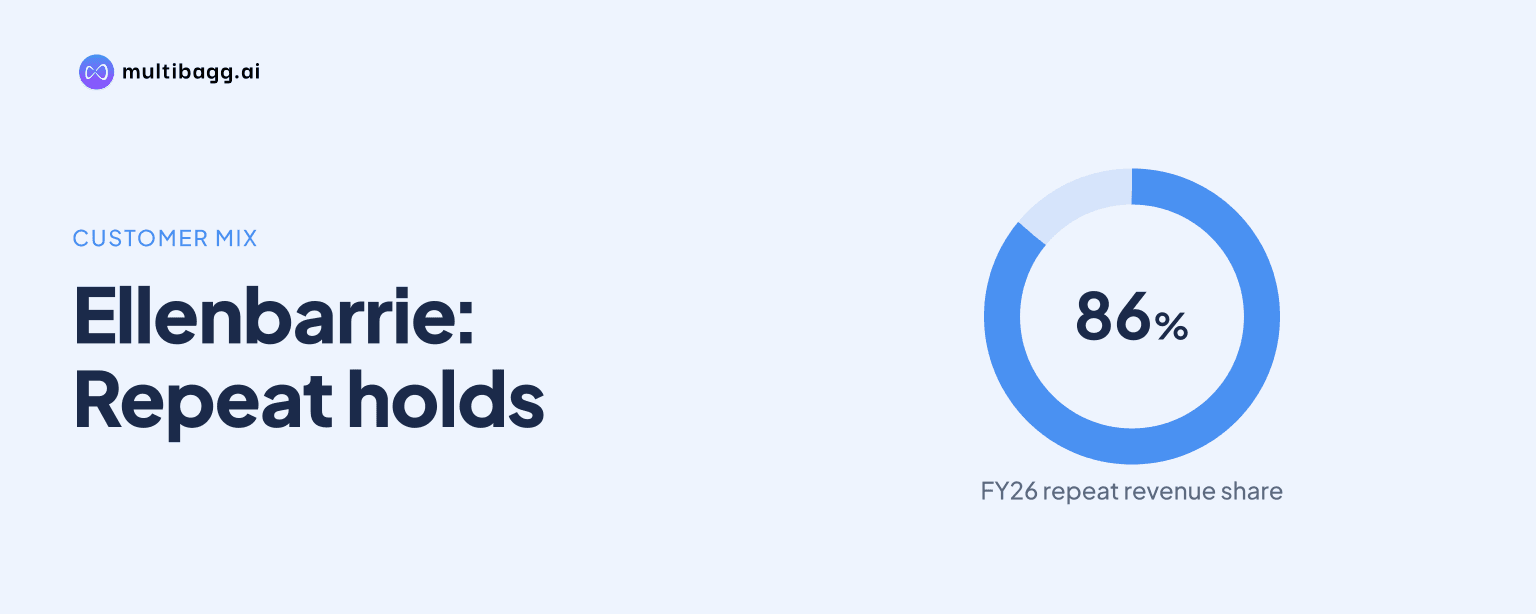
Ellenbarrie derived 86% of FY26 revenue from customers that had purchased for at least two consecutive years, unchanged from FY25, while its largest customer accounted for 6.7% in the presentation’s diversification table and customers with relationships exceeding 10 years generated Rs 127 crore.
Know Ellenbarrie Industrial Gases inside out
Results, valuation, peers and who's buying, in one view.
How much of Ellenbarrie’s revenue came from repeat customers?
Ellenbarrie generated 86% of FY26 revenue from repeat customers, matching FY25 after declining from 92% in FY24. The presentation defines repeat customers as those that have purchased for at least two consecutive years. This measure identifies continuity of purchasing across consecutive years, rather than merely counting customers that returned for a single later transaction.
The six-percentage-point change between FY24 and FY25 was the main movement in the three-year series, while the FY25-to-FY26 result was unchanged at 86%. The presentation does not provide revenue amounts, customer counts or segment-wise repeat-revenue rates for these years. It therefore shows the proportion of revenue meeting the repeat-customer definition, but not whether the FY24-to-FY26 change resulted from lower purchases by existing customers or growth from newer accounts.
How concentrated was Ellenbarrie’s customer base in FY26?
Ellenbarrie’s largest customer represented 6.7%, its top five customers represented 25.9%, and its top 10 customers represented 38.8% in the presentation’s diversification table. The difference between the top-five and top-10 measures was 12.9 percentage points. The table presents percentages but does not separately provide the revenue figures underlying them.
The operating model covered three onsite customers, 328 bulk customers and 1,498 packaged customers as of 31 March 2026. These are separately stated operating customer counts and should not be added to produce a group-wide unique-customer total, because the presentation does not state whether customer relationships overlap between supply formats. They show that the concentration disclosure sits alongside onsite pipeline users, bulk liquid-gas users and packaged-cylinder users.
The largest-customer percentage was lower than the top-10 percentage, at 6.7% versus 38.8%. The presentation does not name customers, disclose their industries, or provide earlier-year concentration percentages. It therefore provides a reported concentration position at the disclosed date, but not a trend showing whether dependence on any individual account has changed.
What supports Ellenbarrie’s repeat revenue?
Ellenbarrie’s disclosed commercial arrangements include onsite contracts lasting 15 to 20 years with take-or-pay provisions, guaranteed returns and cost pass-through. Under the onsite model, Ellenbarrie operates on customer premises and supplies gases through pipelines. It listed three onsite customers and stated that orders for two customers had a 15-year term as of 31 March 2026.
For bulk customers, Ellenbarrie reported 328 customers and an average contract tenure of five years, while merchant contracts generally last three to seven years. Ellenbarrie places infrastructure at customer facilities to unload and store liquefied gas, with supply from an air separation unit, or ASU, by tanker to a customer tank and vaporizer. The presentation says the average bulk contract can be extended for two additional years when mutually agreed.
The packaged business has shorter stated contracts of one to three years, but it had the largest disclosed customer count at 1,498. Ellenbarrie reported 257 bulk customer installations and described packaged supply as gas compressed into cylinders and transported to customers. The presentation links bulk and packaged formats to network density and lists bundled offerings and services for packaged customers, though it does not disclose renewal rates.
Got a follow-up? Ask IRIS
Are Ellenbarrie’s long-term customer relationships growing?
Ellenbarrie increased revenue from customers with relationships of more than 10 years to Rs 127 crore in FY26, from Rs 122.1 crore in FY25 and Rs 117.5 crore in FY24. The FY24-to-FY26 increase was Rs 9.5 crore, while the FY26 year-on-year increase was Rs 4.9 crore. This series covers the customer group defined by relationship duration, rather than total company revenue or total customer retention.
Ellenbarrie reported an average relationship age of 8.2 years for its top five customers and 7.8 years for its top 10 customers. The 0.4-year difference means the five largest customers had a longer reported average relationship than the broader top-10 group. The presentation also displays 37%, 16% and 47% in its relationship-duration discussion, but the supplied chart extract does not identify the duration bands associated with those percentages.
The revenue series for customers with relationships longer than 10 years rose in each of the three disclosed financial years, whereas repeat-customer revenue as a share fell from 92% in FY24 to 86% in FY25 and remained at that level in FY26. The measures address different customer characteristics: one tracks sales linked to relationships exceeding 10 years, while the other applies a two-consecutive-year purchasing threshold. Neither metric provides the number of contracts renewed in a year.
Conclusion
Ellenbarrie’s presentation shows that 86% of FY26 revenue came from customers purchasing in at least two consecutive years, while customers with relationships exceeding 10 years generated Rs 127 crore. Its diversification table places the largest customer at 6.7%, compared with 25.9% for the top five and 38.8% for the top 10. Alongside 328 bulk and 1,498 packaged customers, the disclosures provide detail on repeat purchasing and customer grouping without identifying individual buyers.
The next disclosed expansion items to watch are a North India bulk facility under work in progress with capacity of 220 tonnes per day, or TPD, and a Central India bulk project marked work in progress for FY28 with capacity yet to be determined. Further disclosures on commissioning, contracted customers and the mix of onsite, bulk and packaged revenue would show how these projects affect the customer profile.