










Emerald FY26 capacity rows total 14,280 MT, above 10,560
Key highlights
- Emerald’s FY26 product capacities add to 14,280 MT, versus 10,560 MT on its manufacturing-facility page.
- The two Emerald capacity figures differ by 3,720 MT.
- Emerald’s calculated FY26 utilization was 65.97%, based on 9,420.62 MT of production and 14,280 MT of product capacity.
- Emerald’s product-row capacity was 10,560 MT in FY24 and FY25 before rising to 14,280 MT in FY26.
powered by IRIS
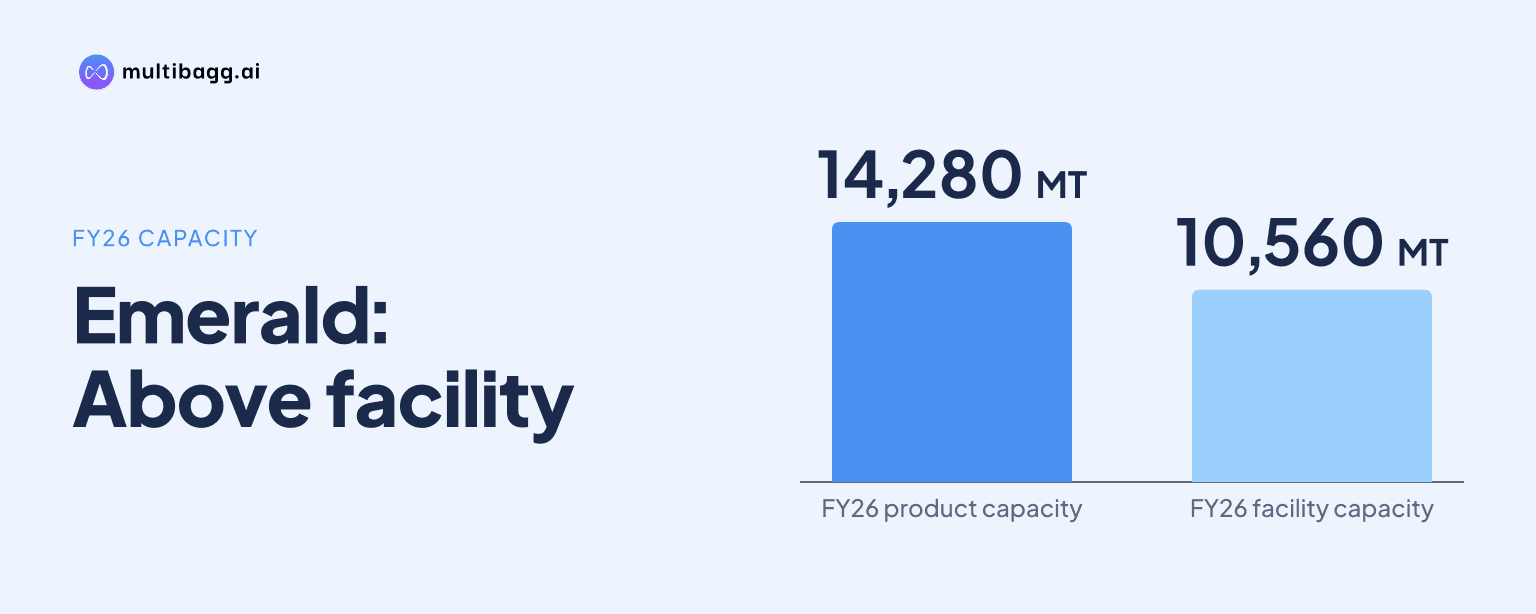
Emerald Tyre Manufacturers Ltd.’s FY26 product-capacity rows total 14,280 metric tonnes (MT), 3,720 MT above the 10,560 MT installed-production-capacity figure on the preceding manufacturing page, and the presentation provides no reconciliation between the two disclosures.
Know Emerald Tyre Manufacturers inside out
Results, valuation, peers and who's buying, in one view.
Why do Emerald’s installed-capacity figures conflict?
Emerald presents two installed-capacity figures, 10,560 MT and 14,280 MT, without stating how they relate to each other. Its integrated-manufacturing page describes a 10.05-acre facility in Tiruvallur District, Tamil Nadu, with installed production capacity of 10,560 MT. The following production-capacity table lists FY26 capacity for four product lines that add to 14,280 MT.
The difference is 3,720 MT, equal to 35.23% of the 10,560 MT figure. Neither page identifies the 10,560 MT number as applying to a particular product mix, an earlier financial year, a subset of equipment or a different capacity definition. The manufacturing page describes the Tiruvallur facility, while the FY26 table separately reports Solid Resilient, Press On, Industrial Pneumatic and Wheel Rims capacity.
The presentation does not establish whether 10,560 MT is an earlier capacity configuration or whether 14,280 MT includes capacity excluded from the facility statement. Since the 10,560 MT figure appears on the manufacturing page and the 14,280 MT sum appears in the FY26 product table, the available disclosure does not identify a single consolidated installed-capacity base for FY26.
What does Emerald’s FY26 product-capacity table show?
Emerald’s FY26 product table supports 14,280 MT of installed capacity when its four reported product lines are added. Solid Resilient is the largest line at 8,288 MT, followed by Industrial Pneumatic at 4,200 MT, Press On at 1,260 MT and Wheel Rims at 532 MT.
The 65.97% total utilization is calculated from reported FY26 production of 9,420.62 MT divided by the 14,280 MT product-row capacity total; it is not printed separately in the presentation. Industrial Pneumatic had the highest listed utilization at 94.36%, while Press On had the lowest at 46.69%.
Solid Resilient represented 58.04% of the calculated 14,280 MT FY26 capacity total. Its 8,288 MT capacity is larger than the 3,720 MT gap between the product-row total and the 10,560 MT facility statement, but the presentation provides no capacity bridge showing which product lines, facilities or definitions account for that gap.
Got a follow-up? Ask IRIS
How did Emerald’s capacity and utilization change?
Emerald’s product rows show installed capacity increasing from 10,560 MT in FY25 to 14,280 MT in FY26, while calculated aggregate utilization declined. FY24 and FY25 each list 5,920 MT for Solid Resilient, 900 MT for Press On, 3,360 MT for Industrial Pneumatic and 380 MT for Wheel Rims, producing the same 10,560 MT total in both years.
The 3,720 MT FY26 capacity increase was recorded across all four listed lines. Solid Resilient increased by 2,368 MT, Industrial Pneumatic by 840 MT, Press On by 360 MT and Wheel Rims by 152 MT. Total production increased by 431.22 MT from FY25 to FY26, meaning output grew less quickly than the product-row capacity base.
Product-level movements differed in FY26. Solid Resilient production fell to 4,491.41 MT from 4,872.16 MT in FY25, and its utilization declined to 54.19% from 82.30%. Press On production declined to 588.24 MT from 676.67 MT, while Industrial Pneumatic production rose to 3,963.20 MT from 3,170.73 MT and utilization remained near 94.36%.
What disclosure remains unresolved for Emerald investors?
Emerald has not disclosed how the 10,560 MT manufacturing-facility figure relates to the 14,280 MT sum of FY26 product capacities. The 10,560 MT number is both the capacity stated for the 10.05-acre Tiruvallur facility and the sum of the product rows in FY24 and FY25. The 14,280 MT total is specific to the four FY26 product rows.
The 3,720 MT difference could reflect commissioned capacity, a changed product scope, a revised measurement basis or a timing difference, but none of these explanations is stated in the presentation. The document gives no commissioning date, capital-expenditure amount, expansion description or note defining a change between the 10,560 MT and 14,280 MT capacity measures.
The discrepancy changes the denominator used to assess FY26 output of 9,420.62 MT. On the 14,280 MT product-row basis, calculated utilization is 65.97%; measured against 10,560 MT, the same production would equal 89.21%. Emerald reports utilization for each of the four products but does not report a consolidated rate or explain which capacity base should be used for FY26.
Conclusion
Emerald’s presentation contains an unreconciled capacity inconsistency: the manufacturing page reports 10,560 MT, while the FY26 product table adds to 14,280 MT. The product-level data also indicate a 3,720 MT capacity increase from FY25 to FY26, whereas total production increased by 431.22 MT, resulting in calculated utilization of 65.97% on the FY26 product-capacity basis.
What to watch next is whether Emerald clarifies the boundary and timing behind the 14,280 MT FY26 total, including its relationship to the 10.05-acre Tiruvallur facility and the 10,560 MT statement. Until a bridge is disclosed between the two figures, the presentation does not establish which installed-capacity total should serve as the consolidated FY26 base.