










Encompass Brands supplied 60% of H1 FY27 EBITDA after 146% rise
Key highlights
- Encompass Brands revenue rose 148% year on year to Rs 20.7 crore in H1 FY27.
- Encompass Brands generated Rs 9.4 crore of H1 FY27 EBITDA, equal to 60% of group EBITDA mix.
- GM & E-Commerce EBITDA was unchanged at Rs 2.9 crore as its margin fell 276 basis points to 27.6%.
- Trading revenue increased 61% to Rs 16.1 crore, while EBITDA margin declined 121 basis points to 19.7%.
powered by IRIS
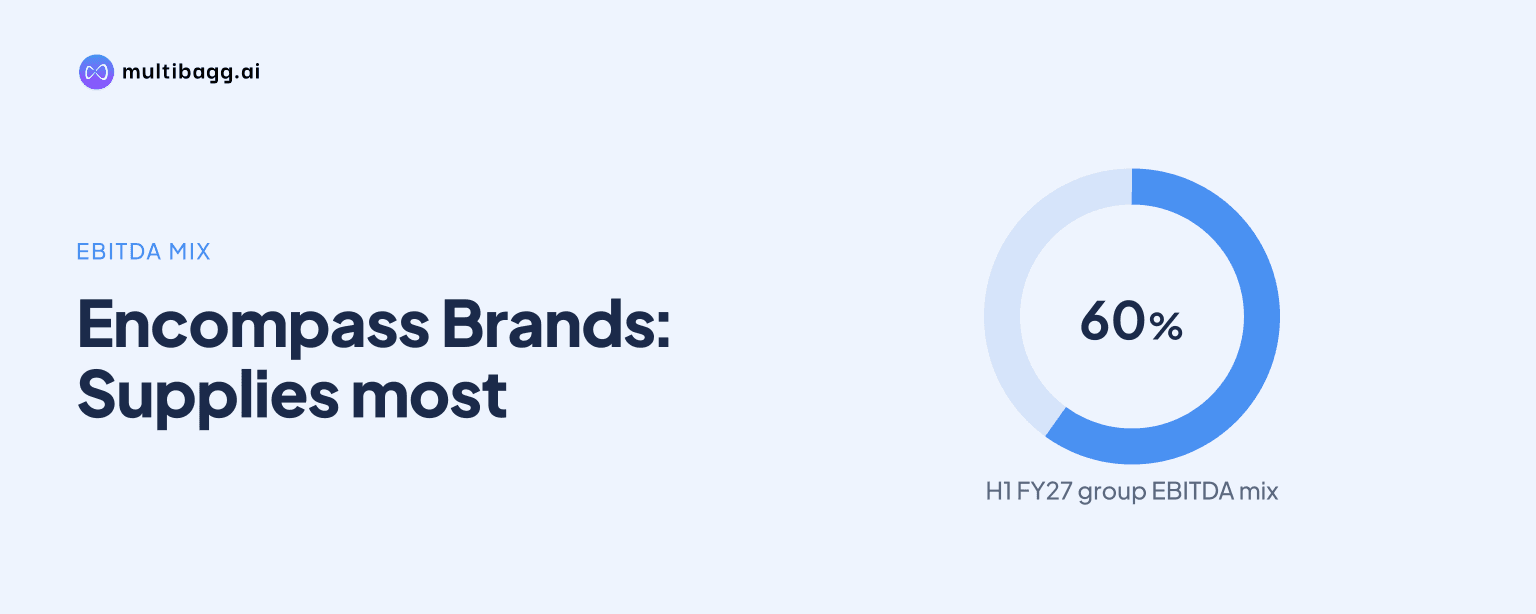
Encompass’s Brands segment supplied 60% of group earnings before interest, taxes, depreciation and amortization (EBITDA) in H1 FY27, generating Rs 9.4 crore after revenue rose 148% year on year to Rs 20.7 crore. The result moved group profitability further toward Brands, while GM & E-Commerce EBITDA was unchanged and Trading margins declined.
Know Encompass Design India inside out
Results, valuation, peers and who's buying, in one view.
How did Encompass segment revenue change in H1 FY27?
Encompass reported sharply different growth rates across its three segments in H1 FY27: Brands revenue rose to Rs 20.7 crore from Rs 8.3 crore in H1 FY26, GM & E-Commerce revenue increased to Rs 10.8 crore from Rs 9.8 crore, and Trading revenue reached Rs 16.1 crore from Rs 10.0 crore. The respective year-on-year increases were 148%, 10% and 61%, compared with group revenue from operations of Rs 47.5 crore, up 69%.
Brands also became the largest reported revenue contributor in the half year, accounting for 43% of group revenue mix versus 33% in FY26. Trading represented 34% of H1 FY27 revenue mix, down from 36% in FY26, while GM & E-Commerce accounted for 23%, compared with 31% in FY26. The mix figures show that Brands’ revenue expansion outpaced the other two businesses.
The half-year result follows an earlier annual rise in Brands revenue, from Rs 8.6 crore in FY24 to Rs 14.0 crore in FY25 and Rs 22.5 crore in FY26. GM & E-Commerce revenue increased from Rs 9.5 crore in FY24 to Rs 21.2 crore in FY26, while Trading revenue moved from Rs 22.0 crore in FY24 to Rs 24.4 crore in FY26. H1 FY27 therefore marked a period in which Brands exceeded both other segments on reported half-year revenue.
Why did Brands account for 60% of Encompass EBITDA?
Brands accounted for 60% of Encompass EBITDA because its H1 FY27 EBITDA rose 146% year on year to Rs 9.4 crore from Rs 3.8 crore. Group operating profit, reported as EBITDA, was Rs 15.5 crore in the half year, up 75%, meaning Brands provided the largest portion of the reported total. Its EBITDA contribution had already risen from 31% in FY24 to 46% in FY26 before reaching 60% in H1 FY27.
GM & E-Commerce recorded EBITDA of Rs 2.9 crore in both H1 FY26 and H1 FY27, so its contribution to group EBITDA fell to 19% from 30% in FY26. Trading EBITDA increased 51% to Rs 3.2 crore from Rs 2.1 crore, but its mix share was 21%, compared with 25% in FY26. These outcomes meant that EBITDA growth in the period was principally associated with Brands rather than evenly distributed across the segments.
Brands’ profit after tax (PAT) rose 175% to Rs 5.1 crore in H1 FY27 from Rs 1.9 crore a year earlier. That gave it 55% of group PAT mix, against 38% in FY26. GM & E-Commerce generated Rs 2.1 crore of H1 FY27 PAT and Trading generated Rs 2.0 crore, with their group PAT shares at 23% and 22%, respectively.
Got a follow-up? Ask IRIS
How did Encompass segment margins change in H1 FY27?
Encompass Brands maintained the highest reported EBITDA margin at 45.3% in H1 FY27, compared with 45.6% in H1 FY26, a decline of 31 basis points. A basis point is one-hundredth of a percentage point. Despite this near-stable margin, the segment’s revenue increase to Rs 20.7 crore produced a Rs 5.6 crore increase in EBITDA.
GM & E-Commerce EBITDA margin declined by 276 basis points to 27.6% from 30.3%, while its EBITDA remained Rs 2.9 crore. Trading margin fell by 121 basis points to 19.7% from 20.9%, although its EBITDA increased to Rs 3.2 crore. The three margins indicate that revenue growth and EBITDA growth did not move in the same way across the businesses.
PAT margins showed another contrast. Brands’ PAT margin increased 243 basis points to 24.7% from 22.3%, GM & E-Commerce PAT margin declined 63 basis points to 19.6%, and Trading PAT margin increased 53 basis points to 12.6%. At the group level, Encompass reported a PAT margin of 19.5%, up 153 basis points, alongside PAT of Rs 9.3 crore, up 83% year on year.
How has Encompass earnings mix changed since FY24?
Encompass’s mix has moved steadily toward Brands since FY24. Brands represented 21% of group revenue, 31% of EBITDA and 24% of PAT in FY24; by H1 FY27, those proportions were 43%, 60% and 55%. In the same comparison, Trading’s EBITDA share declined from 46% to 21%, and GM & E-Commerce’s declined from 23% to 19%.
The historical revenue data place this transition alongside growth in Brands’ absolute earnings. Its EBITDA increased from Rs 3.5 crore in FY24 to Rs 6.3 crore in FY25 and Rs 9.6 crore in FY26. Over the same three financial years, GM & E-Commerce EBITDA rose from Rs 2.6 crore to Rs 6.2 crore, while Trading EBITDA was Rs 5.2 crore in FY24, Rs 5.4 crore in FY25 and Rs 5.0 crore in FY26.
Management describes Brands as the principal growth engine and says it is expected to drive an increasing share of group revenue and earnings. The H1 FY27 figures support the direction of that stated mix objective, but GM & E-Commerce and Trading remained material contributors, together representing 44% of EBITDA and 45% of PAT mix in the half year.
Conclusion
Encompass’s H1 FY27 financial mix was led by Brands: revenue rose 148% to Rs 20.7 crore, EBITDA rose 146% to Rs 9.4 crore, and the segment contributed 60% of group EBITDA. Trading added revenue and EBITDA growth but reported a 121-basis-point margin decline, while GM & E-Commerce delivered 10% revenue growth with unchanged EBITDA of Rs 2.9 crore.
The next result to watch is whether Brands continues to increase its share as management expects, while retaining an EBITDA margin near the 45.3% reported in H1 FY27. The unresolved operating contrast is whether GM & E-Commerce can restore its 30.3% H1 FY26 EBITDA margin after reaching 27.6%, and whether Trading can reverse its margin decline as revenue expands.