










Encompass cash conversion cycle stretched to 203 days in FY26
Key highlights
- Encompass’s cash conversion cycle rose to 203 days in FY26 from 144 days in FY25.
- Inventory days increased to 156 in FY26 from 115 days in FY25, while debtor days rose to 56 from 46.
- Working-capital changes used Rs 11.2 crore in FY26 and Rs 10.2 crore in H1 FY27.
- H1 FY27 cash and cash equivalents increased by Rs 30.1 crore, supported by Rs 43.8 crore of financing cash flow.
powered by IRIS
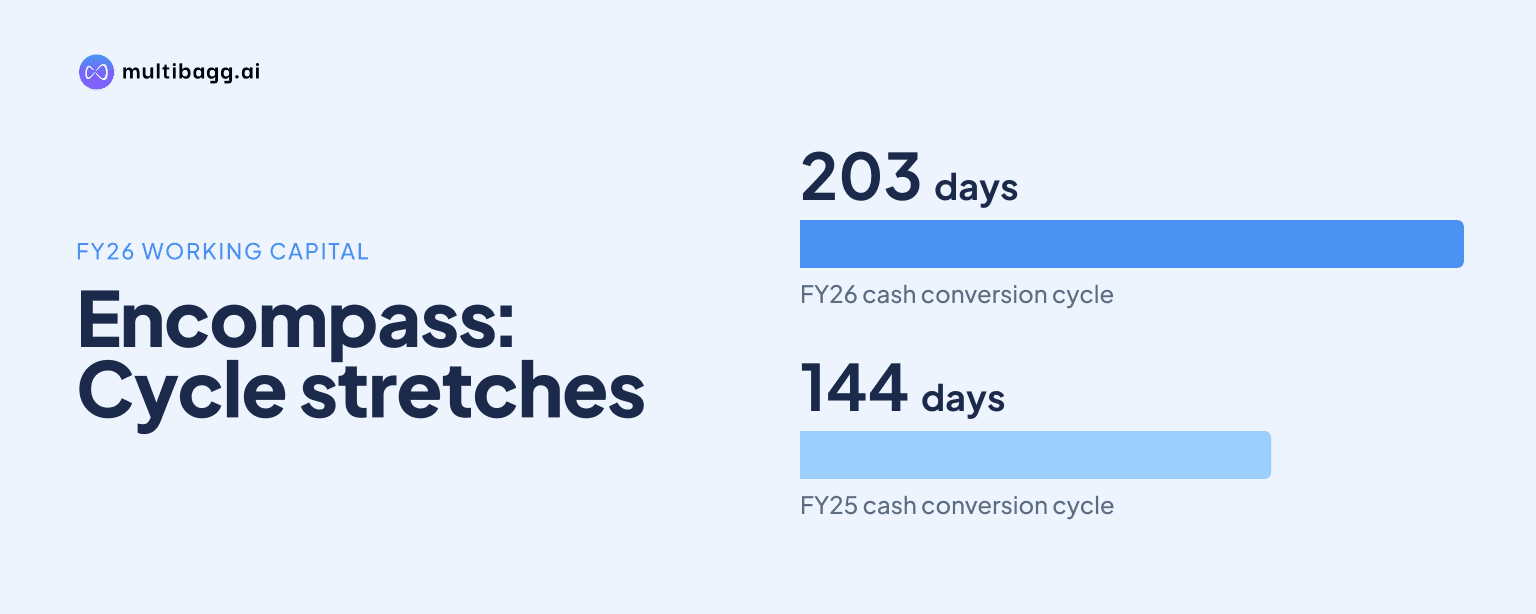
Encompass Design India Limited’s cash conversion cycle stretched to 203 days in FY26 from 144 days in FY25, led by inventory days rising to 156 and debtor days reaching 56. Encompass also reported that working-capital changes used Rs 11.2 crore of cash in FY26, against net operating cash generation of Rs 6.2 crore.
Know Encompass Design India inside out
Results, valuation, peers and who's buying, in one view.
Why did Encompass’s cash conversion cycle reach 203 days?
Encompass’s cash conversion cycle reached 203 days in FY26 because inventory days increased by 41 days to 156 and debtor days rose by 10 days to 56 from FY25. The cycle had already risen to 144 days in FY25 from 119 days in FY24, so it expanded by 84 days over the two financial years to FY26.
Inventory days accounted for the larger increase in the disclosed operating metrics. They rose from 105 days in FY24 to 115 in FY25 and 156 in FY26, a 51-day increase over two years. Debtor days increased from 43 in FY24 to 46 in FY25 and 56 in FY26. The presentation does not provide creditor days or a separate operational explanation for the longer cycle.
How much did Encompass invest in inventory and receivables?
Encompass held Rs 23.3 crore of inventory and Rs 17.5 crore of trade receivables at H1 FY27, compared with Rs 16.3 crore and Rs 12.1 crore at FY26. Inventory therefore increased by Rs 7.0 crore and receivables by Rs 5.4 crore during the first half of FY27, taking their combined balance to Rs 40.8 crore from Rs 28.4 crore.
The same balances had risen through FY24 to FY26 as revenue expanded. Inventory increased from Rs 5.1 crore in FY24 to Rs 10.9 crore in FY25 and Rs 16.3 crore in FY26, while trade receivables rose from Rs 4.8 crore to Rs 8.9 crore and Rs 12.1 crore. Revenue from operations grew from Rs 40.0 crore in FY24 to Rs 54.6 crore in FY25 and Rs 68.1 crore in FY26, alongside the increase in inventory and debtor days.
Other current assets increased to Rs 8.9 crore at H1 FY27 from Rs 4.3 crore at FY26, while short-term loans and advances rose to Rs 4.1 crore from Rs 1.7 crore. Total current assets consequently reached Rs 99.0 crore, compared with Rs 49.6 crore at FY26. Cash and bank balances were Rs 45.2 crore within the H1 FY27 current-asset total.
What was the effect of working capital on Encompass’s operating cash flow?
Working-capital changes used Rs 10.2 crore in H1 FY27, following cash use of Rs 11.2 crore in FY26 and Rs 11.1 crore in FY25. The corresponding use in FY24 was Rs 4.2 crore. These outflows reduced the cash generated from profit before tax and non-cash and non-operating adjustments in each reported period.
Encompass generated Rs 2.6 crore of net cash from operating activities in H1 FY27, after reporting profit before tax of Rs 9.3 crore and Rs 3.2 crore of non-cash and non-operating adjustments. In FY26, profit before tax was Rs 13.0 crore, adjustments were Rs 4.5 crore and operating cash flow was Rs 6.2 crore. The cash-flow statement records direct taxes paid as Rs 0.4 crore in H1 FY27 and Rs 0.2 crore in FY26.
Profit growth exceeded the increase in reported operating cash across the latest full year. Profit after tax increased 21% to Rs 13.0 crore in FY26 from Rs 10.8 crore in FY25, while operating cash flow rose to Rs 6.2 crore from Rs 4.8 crore. In H1 FY27, revenue increased 69% year on year to Rs 47.5 crore and profit after tax rose 83% to Rs 9.3 crore, while operating cash flow was Rs 2.6 crore.
Got a follow-up? Ask IRIS
How were Encompass’s cash increase and capital spending funded?
Encompass’s cash and cash equivalents increased by Rs 30.1 crore in H1 FY27, with Rs 43.8 crore of net financing cash flow exceeding operating cash flow of Rs 2.6 crore and investing outflow of Rs 16.3 crore. Financing included Rs 39.1 crore of net proceeds from share-capital issuance and Rs 5.9 crore of borrowing proceeds, offset by Rs 1.2 crore of interest and lease payments.
Investing cash outflow in H1 FY27 consisted principally of Rs 16.3 crore spent on purchases of net fixed assets. This followed Rs 36.8 crore of fixed-asset purchases in FY26, compared with Rs 9.9 crore in FY25 and Rs 6.4 crore in FY24. Fixed assets including work in progress were Rs 24.3 crore at H1 FY27, and capital work-in-progress was Rs 20.9 crore, versus Rs 22.1 crore and Rs 7.4 crore respectively at FY26.
The balance sheet records equity including reserves and surplus of Rs 130.2 crore at H1 FY27, up from Rs 81.8 crore at FY26. Short-term borrowings increased to Rs 13.0 crore from Rs 10.6 crore, and long-term borrowings rose to Rs 5.9 crore from Rs 2.4 crore. Trade payables increased to Rs 4.2 crore from Rs 0.7 crore, while total current liabilities rose to Rs 28.4 crore from Rs 17.0 crore.
How did Encompass’s returns and margins change in FY26?
Encompass’s return on equity fell to 22.8% in FY26 from 50.3% in FY25 and 66.3% in FY24. Its return on capital employee, or RoCE as labelled in the presentation, declined to 29.3% from 53.8% in FY25 and 54.7% in FY24. Total assets increased to Rs 102.4 crore in FY26 from Rs 53.4 crore in FY25.
Earnings before interest, taxes, depreciation and amortisation, or EBITDA, margin was 30.5% in FY26, compared with 30.9% in FY25 and 28.0% in FY24. Profit-after-tax margin was 19.1% in FY26, versus 19.8% in FY25 and 17.2% in FY24. In H1 FY27, EBITDA margin increased 112 basis points year on year to 32.6%, while profit-after-tax margin rose 153 basis points to 19.5%.
Conclusion
Encompass combined revenue growth to Rs 68.1 crore in FY26 and profit after tax of Rs 13.0 crore with a longer operating cycle: cash conversion reached 203 days as inventory and debtor days rose. The balance sheet through H1 FY27 shows a further Rs 12.4 crore increase in inventories and trade receivables, while recurring working-capital outflows continued to constrain conversion of reported profit into operating cash.
The next reported figures to watch are inventory days, debtor days and the cash conversion cycle after FY26, alongside operating cash generation relative to capital expenditure. The presentation shows Rs 20.9 crore of capital work-in-progress at H1 FY27 and Rs 16.3 crore of fixed-asset purchases in the half year, both of which remain relevant to future investing cash flows.