










Enviro Infra Engineers Limited H1 PAT declines 8% on margins
Key highlights
- EIE’s H1 FY27 revenue from operations rose 54.39% to Rs 723 crore.
- EIE’s H1 FY27 PAT fell 7.91% to Rs 84.7 crore as PAT margin declined 726 basis points to 11.49%.
- EIE’s H1 FY27 EBITDA margin was 20.82%, down 676 basis points from H1 FY26.
- EIE’s combined borrowings rose to Rs 703.9 crore at September 2026 from Rs 422.3 crore at March 2026.
powered by IRIS
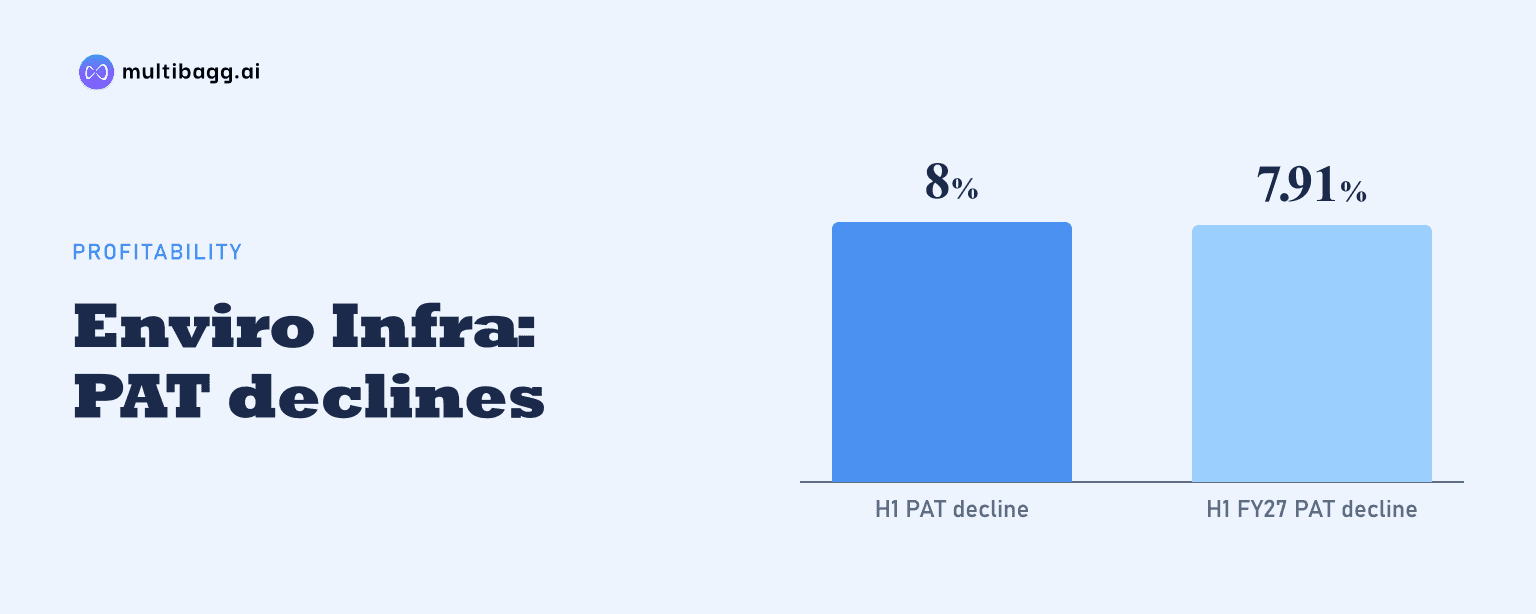
Enviro Infra Engineers Limited reported H1 FY27 revenue from operations of Rs 723 crore, up 54.39% year on year, while profit after tax (PAT) fell 7.91% to Rs 84.7 crore as PAT margin declined 726 basis points to 11.49%. The company is referred to as EIE below.
Know Enviro Infra Engineers inside out
Results, valuation, peers and who's buying, in one view.
How did EIE’s H1 FY27 earnings change?
EIE increased H1 FY27 revenue from operations by Rs 254.7 crore to Rs 723 crore from Rs 468.3 crore in H1 FY26. Total revenue increased 50.29% to Rs 737.3 crore from Rs 490.6 crore. Earnings before interest, tax, depreciation and amortisation (EBITDA), excluding other income, rose 16.56% to Rs 150.5 crore from Rs 129.2 crore, trailing the growth in operating revenue.
EIE’s EBITDA margin was 20.82% in H1 FY27, compared with 27.58% in H1 FY26, a decline of 676 basis points. Profit before tax decreased to Rs 113.9 crore from Rs 120.3 crore, while PAT decreased to Rs 84.7 crore from Rs 92 crore. Basic earnings per share declined to Rs 4.63 from Rs 5.16 over the same periods.
Other income was Rs 14.3 crore in H1 FY27, lower than Rs 22.3 crore in H1 FY26. This Rs 8 crore reduction occurred alongside the expansion in operating revenue and preceded the decrease in reported PAT. The PAT margin fell to 11.49% from 18.75%, representing the stated 726-basis-point year-on-year decline.
Why did EIE’s H1 FY27 margins fall?
EIE’s raw-material cost rose to Rs 496 crore in H1 FY27 from Rs 292.9 crore in H1 FY26, an increase of Rs 203.1 crore. Employee benefit expense increased to Rs 54.5 crore from Rs 29.8 crore, while other expenses rose to Rs 22 crore from Rs 16.4 crore. These three expense lines increased as operating revenue rose by Rs 254.7 crore.
Finance cost more than doubled to Rs 32.5 crore from Rs 14.4 crore, while depreciation and amortisation increased to Rs 18.5 crore from Rs 8.2 crore. The exceptional-item line was Rs 0.1 crore in H1 FY27, compared with negative Rs 8.5 crore in H1 FY26. EIE’s presentation shows these movements between EBITDA and profit before tax as PAT declined despite higher revenue.
The contrast with the full year is also notable. In FY26, EIE’s revenue from operations rose 7.46% to Rs 1,145.6 crore, EBITDA rose 3.36% to Rs 276.8 crore and PAT rose 6.38% to Rs 188.4 crore. In H1 FY27, operating revenue growth accelerated to 54.39%, but EBITDA growth was 16.56% and PAT moved lower by 7.91%.
Got a follow-up? Ask IRIS
What was EIE’s H1 FY27 revenue mix?
EIE reported water revenue of Rs 479.5 crore in H1 FY27, equal to 66% of Rs 723 crore in revenue from operations. Renewable revenue was Rs 203.7 crore, or 29%, while operations and maintenance (O&M) revenue was Rs 22 crore, or 3%. Annuity revenue was Rs 17.7 crore, accounting for the remaining 2%.
By execution model, engineering, procurement and construction (EPC) revenue was Rs 391.9 crore, or 54% of H1 FY27 operating revenue. Renewable EPC contributed Rs 194.6 crore, or 27%, and hybrid annuity model (HAM) revenue was Rs 87.6 crore, or 12%. O&M, independent power producer (IPP) and annuity activities represented 3%, 1% and 2%, respectively.
The H1 FY27 mix differed from EIE’s FY26 full-year mix. Water revenue represented 83% of FY26 revenue from operations of Rs 1,145.6 crore, compared with 66% in H1 FY27. Renewables accounted for 11% in FY26 and 29% in H1 FY27; the presentation does not provide an H1 FY26 category split, so it does not establish year-on-year growth for each revenue category.
How did EIE’s Q2 FY27 and balance sheet change?
EIE’s Q2 FY27 revenue from operations rose 60.01% year on year to Rs 363.8 crore from Rs 227.3 crore in Q2 FY26, while PAT fell 20.22% to Rs 39.5 crore from Rs 49.5 crore. Q2 EBITDA increased to Rs 74.9 crore from Rs 64.9 crore. EBITDA margin declined 798 basis points to 20.58%, and PAT margin declined 989 basis points to 10.62%.
Sequentially, Q2 FY27 operating revenue of Rs 363.8 crore was above Rs 359.2 crore in Q1 FY27. PAT decreased from Rs 45.2 crore in Q1 to Rs 39.5 crore in Q2, and PAT margin moved from 12.38% to 10.62%. Finance cost rose from Rs 14.5 crore to Rs 18 crore, while depreciation and amortisation increased from Rs 8.7 crore to Rs 9.8 crore.
As of September 2026, EIE had long-term borrowings of Rs 348.8 crore and short-term borrowings of Rs 355.1 crore, totalling Rs 703.9 crore. The corresponding combined amount was Rs 422.3 crore at March 2026, comprising Rs 247.3 crore of long-term and Rs 175 crore of short-term borrowings. Trade receivables increased to Rs 321.8 crore from Rs 165.3 crore, while cash and cash equivalents rose to Rs 67.1 crore from Rs 52 crore.
Conclusion
EIE’s H1 FY27 result shows that Rs 254.7 crore of additional operating revenue did not translate into higher profit. EBITDA increased by Rs 21.3 crore, but PAT decreased by Rs 7.3 crore as the EBITDA margin fell 676 basis points and the PAT margin declined 726 basis points. The H1 revenue mix also included Rs 203.7 crore of renewable revenue, or 29% of operating revenue.
The unresolved movements to watch in EIE’s disclosed figures are the relationship between revenue growth and margins, as well as balance-sheet changes after September 2026. Combined borrowings increased by Rs 281.6 crore from March 2026 to September 2026, and trade receivables increased by Rs 156.5 crore over the same period.