










Exato H1 FY27 profit rose 80.47% as margin expanded
Key highlights
- Exato reported H1 FY27 PAT of Rs 13.0892 crore, up 80.47% year on year.
- H1 FY27 revenue from operations reached Rs 102.5404 crore, up 44.29% year on year.
- H1 FY27 PAT margin increased 255 basis points to 12.76%.
- Licences accounted for 77.10% of Exato’s Q2 FY27 consolidated solution revenue.
powered by IRIS
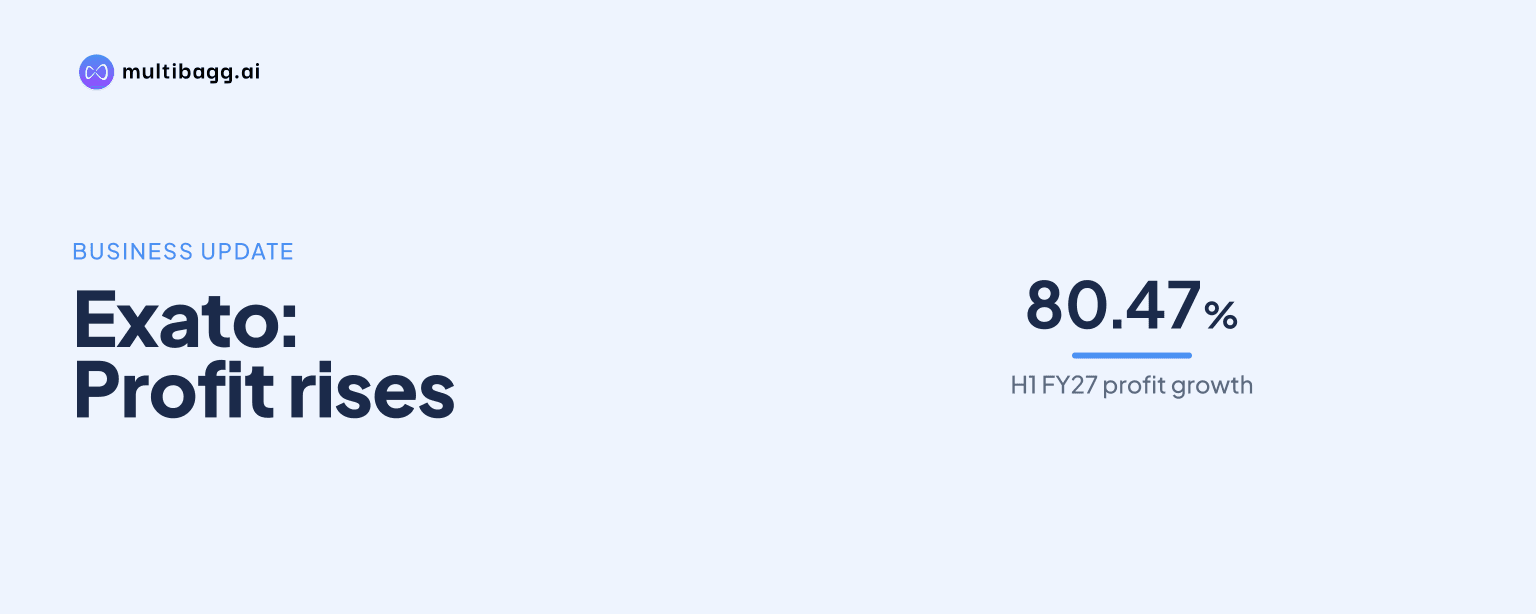
Exato Technologies Limited reported H1 FY27 profit after tax of Rs 13.0892 crore, up 80.47% year on year, while profit-after-tax margin increased 255 basis points to 12.76% from 10.21%. Revenue from operations rose 44.29% to Rs 102.5404 crore, meaning profit growth outpaced the increase in sales during the unaudited first half.
Know Exato Technologies inside out
Results, valuation, peers and who's buying, in one view.
How did Exato perform in H1 FY27?
Exato recorded H1 FY27 revenue from operations of Rs 102.5404 crore, up 44.29% from Rs 71.0641 crore in H1 FY26, while profit after tax, or PAT, rose to Rs 13.0892 crore from Rs 7.2532 crore. The presentation says first-half revenue equalled 61% of Exato’s full-year FY26 revenue.
Total income increased 44.18% to Rs 103.045 crore from Rs 71.4708 crore, including other income of Rs 50.46 lakh, up 24.07% from Rs 40.67 lakh. Earnings before interest, tax, depreciation and amortization, or EBITDA, rose 67.12% to Rs 19.1716 crore from Rs 11.4718 crore, while profit before tax increased 80.80% to Rs 18.2611 crore from Rs 10.0999 crore.
Why did Exato’s H1 FY27 margins increase?
Exato’s reported margins increased as total expenses rose 39.79%, slower than the 44.18% growth in total income. Total expenses reached Rs 83.8734 crore in H1 FY27, compared with Rs 59.999 crore in H1 FY26, while EBITDA margin expanded 256 basis points to 18.70% from 16.14%.
PAT margin increased 255 basis points to 12.76% from 10.21%, alongside the 80.47% rise in PAT. Finance costs declined 59.77% to Rs 39.68 lakh from Rs 98.63 lakh, while depreciation and amortization expense increased 35.03% to Rs 50.57 lakh from Rs 37.45 lakh. The presentation does not identify a specific operational driver for the margin increase.
Exato defines EBITDA as including other income, which was Rs 50.46 lakh in H1 FY27. Its margins are calculated on revenue from operations, while total expenses exclude depreciation, amortization and finance costs. These definitions explain why the reported EBITDA measure and margin should be read alongside the separate income and cost lines.
How did Exato’s Q2 FY27 compare with H1 FY27?
Exato’s Q2 FY27 revenue from operations grew 40.23% to Rs 58.857 crore from Rs 41.9727 crore in Q2 FY26, below the 44.29% H1 growth rate. Q2 PAT rose 65.26% to Rs 7.4449 crore from Rs 4.505 crore, also below the 80.47% increase recorded for the first half.
Q2 EBITDA increased 57.88% to Rs 11.0228 crore from Rs 6.9816 crore, and its margin rose 210 basis points to 18.73% from 16.63%. Q2 PAT margin rose 192 basis points to 12.65% from 10.73%, compared with H1 PAT-margin expansion of 255 basis points. The presentation therefore shows margin improvement in both periods, with the first-half year-on-year improvement larger.
Got a follow-up? Ask IRIS
What was Exato’s Q2 FY27 revenue mix?
Exato’s Q2 FY27 consolidated revenue mix was primarily domestic and licence-led. Domestic revenue represented 73.61%, compared with export revenue of 26.39%, while India accounted for 76.83% of the global-reach split, followed by the United Kingdom at 19.28% and the United States at 3.89%.
Licences represented 77.10% of Q2 FY27 solution revenue, compared with 11.62% for implementation and consulting services and 11.28% for maintenance and repair services of telecom equipment. By sector, business-process outsourcing and information-technology-enabled services accounted for 47.12%, information technology and IT-enabled services for 42.74%, and banking, financial services and insurance for 9.04%.
Manufacturing contributed 0.64% of Q2 FY27 sector revenue and other sectors contributed 0.46%. The presentation does not provide prior-period revenue mix data, growth by solution type, or profitability by region, sector or solution. It therefore establishes the Q2 composition but not whether the licence share or domestic concentration changed from earlier periods.
What do Exato’s H1 FY27 figures indicate about costs?
Exato’s H1 figures show that expenses grew more slowly than income, with total expenses rising 39.79% and total income rising 44.18%. This reported gap coincided with EBITDA growth of 67.12%, from Rs 11.4718 crore to Rs 19.1716 crore, and an EBITDA-margin increase of 256 basis points to 18.70%.
Below EBITDA, finance costs fell by Rs 58.95 lakh year on year, from Rs 98.63 lakh to Rs 39.68 lakh. Depreciation and amortization increased by Rs 13.12 lakh to Rs 50.57 lakh, total tax expense rose 81.68% to Rs 5.1719 crore, and prior-period items were Rs 80,000 versus Rs 1.11 lakh. The presentation does not provide a fuller expense breakdown to assign the margin expansion to individual operating cost categories.
Conclusion
Exato combined 44.29% H1 FY27 revenue growth with 80.47% PAT growth, increasing PAT margin to 12.76% and EBITDA margin to 18.70%. The result reflects total-expense growth of 39.79% against 44.18% growth in total income, together with lower finance costs, although the presentation does not isolate the contribution of each factor.
What to watch next is whether the 77.10% licence share in Q2 FY27, domestic revenue share of 73.61%, and lower finance-cost level of Rs 39.68 lakh persist through the rest of FY27. Exato disclosed no FY27 revenue or profit target in the presentation, leaving subsequent reported results as the available measure of whether first-half margin expansion continues.