










Fusion CX H1 FY27 PAT rises 56.3% as margin reaches 11.2%
Key highlights
- Fusion CX reported H1 FY27 PAT of Rs 114.2 crore, up 56.3% year on year.
- Fusion CX’s H1 FY27 revenue from operations rose 20.4% to Rs 1,015.8 crore.
- Fusion CX’s H1 FY27 EBITDA margin increased to 19.0% from 17.9% a year earlier.
- Fusion CX’s Q2 FY27 DSO improved to 73 days from 83 days in Q2 FY26.
powered by IRIS
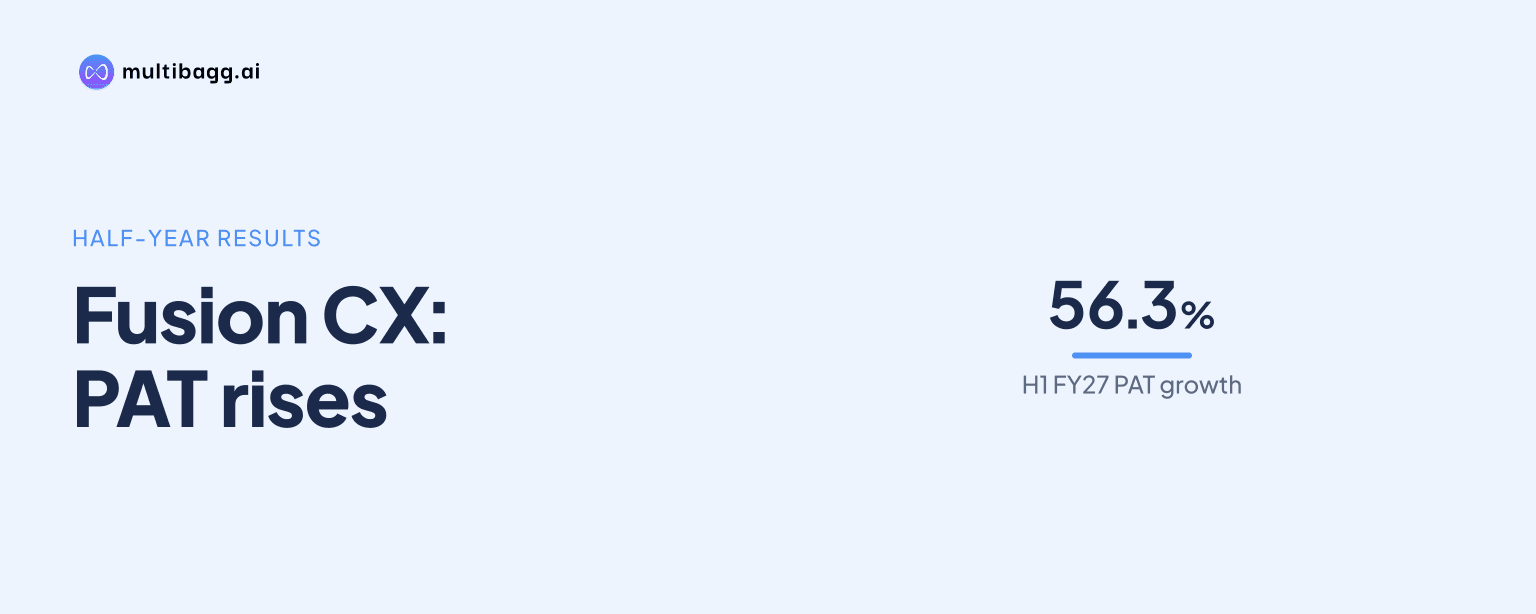
Fusion CX Limited reported H1 FY27 profit after tax of Rs 114.2 crore, up 56.3% year on year, while PAT margin increased to 11.2% from 8.7%. Revenue from operations rose 20.4% to Rs 1,015.8 crore and EBITDA margin improved to 19.0% from 17.9%.
Know Fusion CX inside out
Results, valuation, peers and who's buying, in one view.
How did Fusion CX perform in H1 FY27?
Fusion CX grew profit faster than revenue in H1 FY27. Revenue from operations increased to Rs 1,015.8 crore from Rs 843.4 crore in H1 FY26, while profit after tax, or PAT, rose to Rs 114.2 crore from Rs 73.1 crore. The reported revenue growth was 20.4%, compared with PAT growth of 56.3%.
Total income rose 22.0% to Rs 1,044.2 crore in the half year ended 30 September 2026, including other income of Rs 28.4 crore, compared with Rs 12.3 crore a year earlier. Earnings before interest, tax, depreciation and amortisation, or EBITDA, increased 27.7% to Rs 192.7 crore from Rs 151.0 crore.
Fusion CX’s longer-term presentation shows revenue from operations rising from Rs 991.3 crore in FY24 to Rs 1,818.1 crore in FY26, which management states represents a 35.4% compound annual growth rate, or CAGR. PAT increased from Rs 59.8 crore to Rs 209.1 crore over FY24 to FY26, for a stated CAGR of 116.4%.
How did Fusion CX’s margins change in H1 FY27?
Fusion CX’s PAT margin increased by 250 basis points to 11.2% in H1 FY27 from 8.7% in H1 FY26, while EBITDA margin rose by 110 basis points to 19.0%. A basis point is one-hundredth of a percentage point. The presentation does not assign the half-year margin movement to a specific operating driver.
The consolidated income statement for the half year ended 30 September 2026 recorded profit before tax of Rs 126.3 crore and total tax expense of Rs 12.1 crore, producing PAT of Rs 114.2 crore. Employee benefits expense was Rs 692.6 crore, other expenses were Rs 158.8 crore, depreciation and amortisation was Rs 47.7 crore, and finance costs were Rs 18.7 crore.
The quarterly margin comparison was different from the half-year trend. Q2 FY27 EBITDA margin was 18.6%, below 19.7% in Q2 FY26 and 19.4% in Q1 FY27, while Q2 PAT margin was 11.2%, above 10.4% a year earlier but below 11.3% in Q1 FY27.
How did Fusion CX’s Q2 FY27 compare with Q1 and last year?
Fusion CX increased Q2 FY27 revenue and PAT from Q1 FY27. Revenue from operations rose 7.1% sequentially to Rs 525.3 crore from Rs 490.5 crore, and PAT increased 5.4% to Rs 58.6 crore from Rs 55.6 crore. Total income rose 7.2% to Rs 540.3 crore.
Q2 FY27 EBITDA was Rs 97.6 crore, up 2.7% from Rs 95.1 crore in Q1 FY27. As revenue increased faster than EBITDA, the EBITDA margin declined by 80 basis points sequentially to 18.6% from 19.4%.
Against Q2 FY26, revenue rose 22.1% from Rs 430.3 crore, while EBITDA increased 15.2% from Rs 84.7 crore. PAT increased 31.3% from Rs 44.7 crore. The differing growth rates coincided with Q2 EBITDA margin falling year on year, even as Q2 PAT margin increased by 80 basis points.
Got a follow-up? Ask IRIS
What do Fusion CX’s operating metrics show?
Fusion CX had 15,101 employees at the end of Q2 FY27, compared with 12,401 at Q2 FY26 and 13,735 at Q1 FY27. Annualised revenue per employee remained Rs 14 lakh in all three reported periods. Annualised voluntary attrition was 29.4%, compared with 29.9% a year earlier and 31.2% in Q1 FY27.
Nearshore delivery generated 39.7% of Q2 FY27 revenue, ahead of onshore at 33.3% and offshore at 27.0%. Compared with Q2 FY26, nearshore increased from 29.1%, while onshore fell from 44.7%; offshore rose from 26.2%.
The US and Canada accounted for 81.0% of Q2 FY27 revenue, down from 82.1% in Q2 FY26 and 84.1% in Q1 FY27. Telecom and Other Utilities remained the largest vertical at 39.2%, down from 48.6% a year earlier, while Banking, Financial Services and Insurance increased to 18.2% from 13.7% and Healthcare and Life Sciences rose to 14.5% from 11.4%.
What changed in Fusion CX’s cash, debt and client metrics?
Fusion CX reported net cash from operations of Rs 129.3 crore in H1 FY27, compared with Rs 264.2 crore for full-year FY26 and Rs 102.4 crore in FY25. The H1 FY27 amount exceeded the period’s PAT of Rs 114.2 crore, but the half-year and full-year cash-flow figures are not directly comparable.
Debt to equity was 0.5 times at Q2 FY27, compared with 0.6 times at Q2 FY26 and 0.4 times at Q1 FY27. Days sales outstanding, or DSO, were 73 days, down from 83 days a year earlier and 77 days in Q1 FY27.
Client concentration declined across both reported measures. The top five clients accounted for 36.5% of Q2 FY27 revenue, versus 42.5% in Q2 FY26, while the top 10 accounted for 48.9%, down from 52.1%. Their Q1 FY27 shares were 38.6% and 49.7%, respectively.
Conclusion
Fusion CX’s H1 FY27 results combined 20.4% revenue growth with 27.7% EBITDA growth and 56.3% PAT growth. The half-year margin increase occurred alongside higher other income, while Q2 showed a different pattern: EBITDA growth trailed revenue growth and EBITDA margin declined year on year.
What to watch next is whether Fusion CX can sustain its 19.0% H1 EBITDA margin after Q2 margin reached 18.6%, below both Q1 FY27’s 19.4% and Q2 FY26’s 19.7%. The presentation also leaves investors with measurable operating changes to track, including DSO at 73 days, debt to equity at 0.5 times, and nearshore delivery’s 39.7% revenue share.