










GRM FY26 income rose while four-year margins contracted
Key highlights
- GRM’s FY26 total income rose to Rs 1,805.9 crore from Rs 1,374.2 crore in FY25.
- GRM’s EBITDA margin declined to 7.0% in FY26 from 8.0% in FY23.
- GRM’s debt-to-equity ratio fell to 0.6 times in FY26 from 1.5 times in FY23.
- GRM’s short-term borrowings declined by Rs 82.5 crore to Rs 282.8 crore at Sep 26.
powered by IRIS
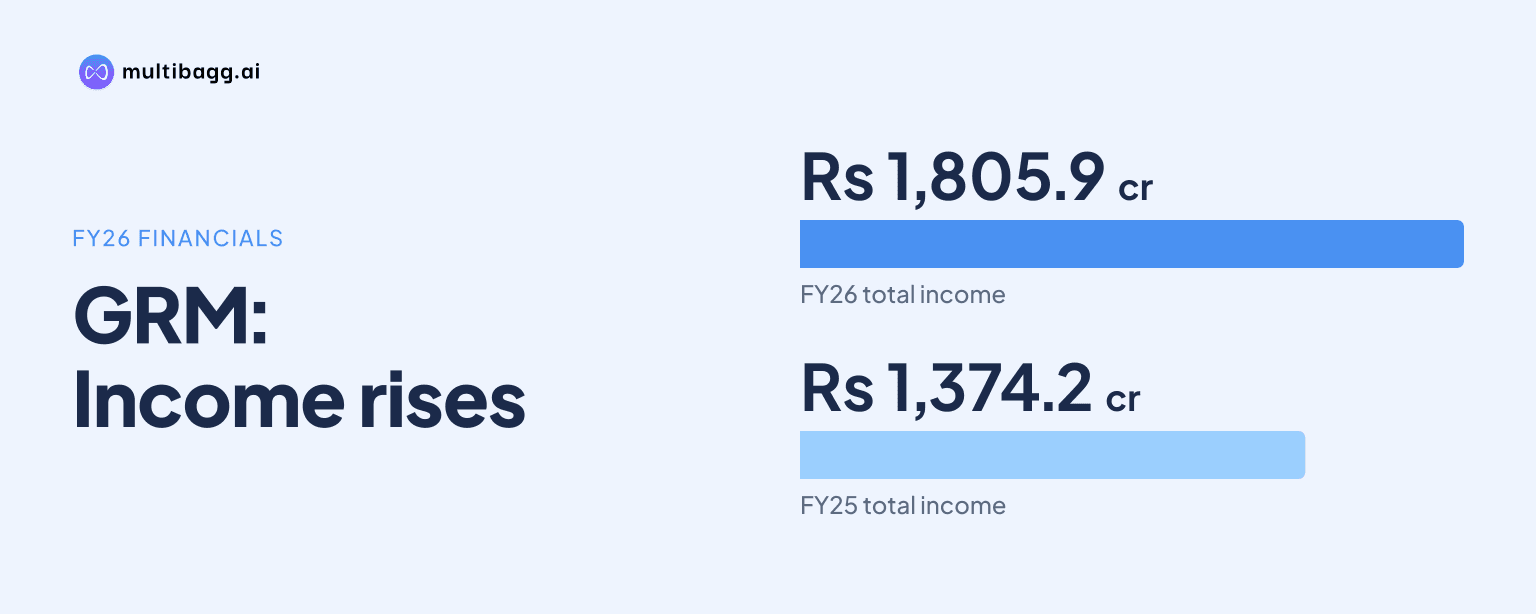
In financial year 2026 (FY26), GRM Overseas Limited reported total income of Rs 1,805.9 crore, up from Rs 1,374.2 crore in FY25, while earnings before interest, tax, depreciation and amortisation (EBITDA) margin declined to 7.0% from 8.0% in FY23 and debt to equity fell to 0.6 times from 1.5 times.
Know GRM Overseas inside out
Results, valuation, peers and who's buying, in one view.
Why did GRM’s total income rise in FY26?
GRM’s total income rose in FY26 because revenue from operations increased to Rs 1,796.2 crore from Rs 1,348.2 crore in FY25, an increase of Rs 448.0 crore. Other income also increased to Rs 36.7 crore from Rs 26.0 crore, taking total income up by Rs 431.7 crore year on year.
FY26 followed two years in which total income remained below the FY23 level of Rs 1,392.2 crore. Total income declined to Rs 1,345.0 crore in FY24, recovered to Rs 1,374.2 crore in FY25, and then exceeded the FY23 figure by Rs 413.7 crore in FY26.
How did GRM’s profitability change from FY23 to FY26?
GRM’s absolute EBITDA and profit after tax increased by FY26, but both reported margins were below their FY23 levels. EBITDA rose to Rs 127.0 crore in FY26 from Rs 111.0 crore in FY23, while EBITDA margin decreased by 1.0 percentage point to 7.0% from 8.0%.
Profit after tax (PAT) reached Rs 76.0 crore in FY26, compared with Rs 62.9 crore in FY23 and Rs 61.2 crore in FY25. PAT margin was 4.2% in FY26, compared with 4.5% in FY23 and FY25 and 4.6% in FY24, the highest margin shown over the four years.
The presentation does not state a cause for the margin changes. Its figures show total income increased by Rs 413.7 crore between FY23 and FY26, while EBITDA increased by Rs 16.0 crore, indicating that EBITDA grew less quickly than income over that period.
Finance cost rose to Rs 22.7 crore in FY26 from Rs 17.8 crore in FY25 and Rs 19.8 crore in FY23. Profit before tax rose to Rs 100.7 crore from Rs 84.7 crore in FY25, while tax expense increased to Rs 24.7 crore from Rs 23.5 crore, resulting in FY26 PAT of Rs 76.0 crore.
Has GRM reduced leverage and borrowing balances?
GRM reduced its reported debt-to-equity ratio in each financial year shown, from 1.5 times in FY23 to 1.2 times in FY24, 0.9 times in FY25 and 0.6 times in FY26. The FY26 ratio was therefore 0.9 times below the FY23 reading in the consolidated historical financials.
Interest coverage did not move in the same direction in every year. The ratio was 5.4 times in FY23, fell to 4.9 times in FY24, rose to 5.8 times in FY25 and returned to 5.4 times in FY26, when finance cost was Rs 22.7 crore.
The balance sheet shows short-term borrowings of Rs 282.8 crore at Sep 26, down from Rs 365.3 crore at Mar 26. Long-term borrowings increased to Rs 1.1 crore from Rs 0.7 crore, while other equity rose to Rs 599.6 crore from Rs 560.2 crore and equity share capital remained Rs 41.4 crore.
Got a follow-up? Ask IRIS
What changed in GRM’s balance sheet by Sep 26?
GRM’s total assets and total equity and liabilities decreased to Rs 1,013.6 crore at Sep 26 from Rs 1,160.2 crore at Mar 26. The Rs 146.6 crore reduction coincided with lower trade receivables, inventories, short-term borrowings and other current liabilities.
Trade receivables fell to Rs 452.8 crore at Sep 26 from Rs 577.0 crore at Mar 26, while inventories declined to Rs 370.5 crore from Rs 435.1 crore. Cash and bank balance rose to Rs 74.8 crore from Rs 73.5 crore over the same period.
Other current liabilities decreased to Rs 40.4 crore at Sep 26 from Rs 137.0 crore at Mar 26, and trade payables declined to Rs 37.6 crore from Rs 47.4 crore. Property, plant and equipment increased to Rs 56.3 crore from Rs 38.6 crore, while capital work-in-progress was Rs 0.7 crore at Sep 26.
What is GRM’s stated revenue-mix plan?
GRM states that private-label business contributes 95% of current revenue, and management’s plan is to maintain its hold in that segment. The presentation cites orders from a government agency in Oman and Al-Nageeb Group in Yemen in relation to the private-label business.
GRM states that own brands contribute the remaining 5% of revenue, with a plan to enter newer markets and grow branded rice sales. It says Tanoush expanded through agreements with major distributors in Georgia, Chile and Morocco, while 10X was recently launched in 12 international markets.
The presentation identifies Himalaya River and Tanoush as global basmati brands and lists offerings including organic basmati, 1121 Emperor, 1401 King and brown basmati rice under Tanoush. It does not disclose separate revenue, EBITDA or PAT for private-label and own-brand operations, so FY26 income of Rs 1,805.9 crore cannot be allocated between the two segments from the supplied figures.
Conclusion
GRM’s FY26 financials show a substantial increase in income and absolute profit after two years of lower total income than FY23. At the same time, EBITDA margin moved from 8.0% in FY23 to 7.0% in FY26 and PAT margin moved from 4.5% to 4.2%, while debt to equity declined from 1.5 times to 0.6 times.
The next reported periods will show the execution of management’s plan to maintain private-label business, which represents 95% of revenue, while expanding own brands from their 5% contribution. Investors can also track whether the Tanoush distributor agreements and the 10X launch in 12 markets coincide with changes in revenue mix or the reported 7.0% EBITDA margin.