










Hy-Tech Engineers’ FY26 PAT CAGR exceeded revenue growth
Key highlights
- Hy-Tech Engineers reported FY24–FY26 revenue CAGR of 17%, reaching Rs 189.4 crore in FY26.
- Hy-Tech Engineers’ EBITDA rose to Rs 41.7 crore in FY26 and its margin increased to 22.0% from 16.4% in FY24.
- Hy-Tech Engineers reported PAT CAGR of 40%, with FY26 PAT of Rs 22.6 crore.
- Hy-Tech Engineers generated Rs 30.3 crore of FY26 operating cash flow and reported a 0.24 times debt-to-equity ratio.
powered by IRIS
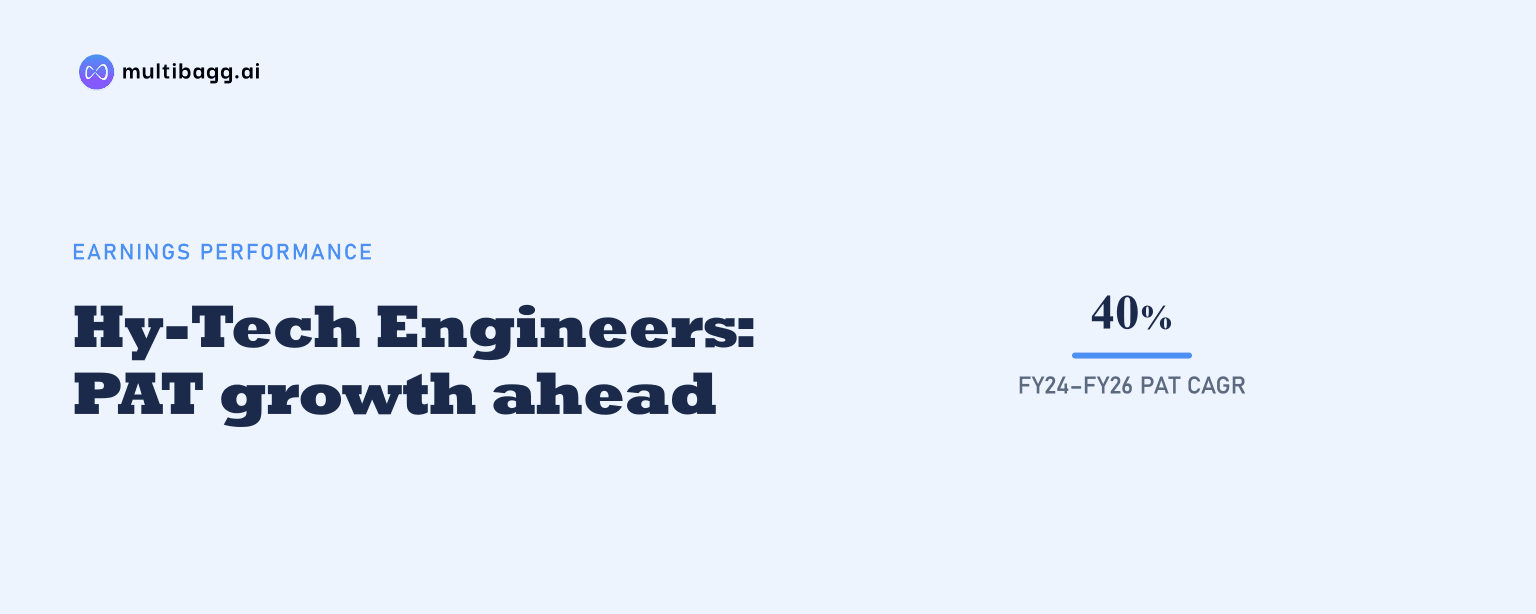
Hy-Tech Engineers Limited reported a 40% profit after tax (PAT) compound annual growth rate (CAGR) in FY24–FY26 against a 17% revenue CAGR, while earnings before interest, tax, depreciation and amortisation (EBITDA) margin increased to 22.0% in FY26 from 16.4% in FY24, on FY26 revenue of Rs 189.4 crore.
Know Hy-Tech Engineers inside out
Results, valuation, peers and who's buying, in one view.
How did Hy-Tech Engineers grow revenue and profit?
Hy-Tech Engineers increased revenue from operations from Rs 137.7 crore in FY24 to Rs 161.4 crore in FY25 and Rs 189.4 crore in FY26, an increase of Rs 51.7 crore over the three-year track record. The presentation reports a 17% CAGR for revenue over FY24–FY26.
EBITDA rose faster than revenue, from Rs 22.6 crore in FY24 to Rs 35.8 crore in FY25 and Rs 41.7 crore in FY26. PAT similarly rose from Rs 11.6 crore to Rs 19.6 crore and then Rs 22.6 crore, with the presentation reporting 36% EBITDA CAGR and 40% PAT CAGR. Basic earnings per share increased from Rs 1.39 in FY24 to Rs 2.70 in FY26.
The pace of change differed across these measures. Revenue increased 37.5% between FY24 and FY26, while EBITDA increased 84.5% and PAT increased 94.8%, based on the disclosed figures. The faster growth in earnings coincided with EBITDA margin moving above its FY24 level.
What changed in Hy-Tech Engineers’ profit margins?
Hy-Tech Engineers’ EBITDA margin was 22.0% in FY26, 5.6 percentage points above the 16.4% reported in FY24. The margin reached 22.2% in FY25 before decreasing by 0.2 percentage points in FY26, but the FY26 level remained above the FY24 base.
PAT margin followed the same broad direction, rising from 8.4% in FY24 to 12.2% in FY25 before settling at 11.9% in FY26. The FY26 PAT margin was 3.5 percentage points above FY24 and 0.3 percentage points below FY25, alongside the difference between the disclosed revenue, EBITDA and PAT CAGRs.
Below EBITDA, depreciation and amortisation expense increased from Rs 7.3 crore in FY24 to Rs 10.7 crore in FY26, while finance cost rose from Rs 2.9 crore to Rs 4.5 crore. Other income was Rs 4 crore in FY26 versus Rs 3.5 crore in FY24, and profit before tax increased from Rs 15.8 crore to Rs 30.6 crore.
How did Hy-Tech Engineers’ costs move with sales?
Hy-Tech Engineers reported raw-material and component consumption of Rs 67.3 crore in FY26, manufacturing and operating expenses of Rs 45.8 crore, and employee benefit expense of Rs 23.4 crore. Other expenses were Rs 12.6 crore and the change in inventories of finished goods and work in progress was negative Rs 1.3 crore, against FY26 revenue of Rs 189.4 crore.
In FY24, raw-material and component consumption was Rs 50.4 crore, manufacturing and operating expenses were Rs 34.3 crore, and employee benefit expense was Rs 19.2 crore. Other expenses were Rs 11.9 crore, while the inventory change was negative Rs 0.7 crore; EBITDA margin subsequently increased from 16.4% in FY24 to 22.0% in FY26.
The presentation does not attribute the margin movement to any individual expense category. It reports tax expense of Rs 8 crore in FY26, compared with Rs 4.2 crore in FY24, while PAT increased by Rs 11 crore over the same period.
Got a follow-up? Ask IRIS
How did Hy-Tech Engineers’ cash flow and leverage change?
Hy-Tech Engineers generated net cash from operations of Rs 30.3 crore in FY26, compared with Rs 17 crore in FY25 and Rs 18.7 crore in FY24. FY26 operating cash flow was Rs 7.7 crore above FY26 PAT of Rs 22.6 crore, while cash flow from investing activities was negative Rs 7.2 crore.
Long-term borrowings were Rs 17.1 crore and short-term borrowings were Rs 12.6 crore at March 2026, totalling Rs 29.7 crore. That total was down from Rs 43.5 crore at March 2025, and the reported debt-to-equity ratio declined to 0.24 times from 0.43 times in March 2025 and 0.50 times in March 2024.
Net worth increased to Rs 122 crore at March 2026 from Rs 101.3 crore a year earlier and Rs 82.2 crore in March 2024. Total assets were Rs 175.8 crore, including trade receivables of Rs 49.9 crore and inventories of Rs 28.4 crore; cash and bank balance was Rs 15 crore.
Where does Hy-Tech Engineers’ revenue come from?
Hy-Tech Engineers reported that the Others category represented 34.4% of its revenue mix, followed by construction machinery at 22.9% and farming at 22.8%. The presentation defines Others as unidentified sectors sold through distributors, while automotive accounted for 9.1%, hydraulic systems 5.1%, injection moulding machines 4.0%, IPE and Railways 1.5%, and parking systems 0.3%.
Direct sales to original equipment manufacturers accounted for 88.4% of revenue and distributors represented 11.6%. Domestic business contributed 70.6% of the mix, overseas business 29.4%, and repeat customers 95.1%, compared with 4.9% from new customers.
The disclosed mix provides context for the Rs 189.4 crore FY26 revenue base, but it does not include revenue amounts or prior-year comparisons for the industry, geography or channel categories. It therefore identifies the composition of revenue without quantifying the growth rate of each segment.
Conclusion
Hy-Tech Engineers’ FY24–FY26 record shows earnings increasing faster than revenue as EBITDA margin rose from 16.4% to 22.0%. FY26 revenue was Rs 189.4 crore, EBITDA was Rs 41.7 crore and PAT was Rs 22.6 crore, while net cash from operations reached Rs 30.3 crore and debt-to-equity was 0.24 times.
What to watch next is execution of Hy-Tech Engineers’ plan to expand capacity at Shirwal, Kavathe and Pithampur Unit-I through automation and high-precision machinery, partly funded by initial public offering proceeds. Management also plans to expand domestic and international distribution, use Railways and Defence certifications for higher-reliability applications, evaluate valves, and build the United States business through HY-TECH ENGINEERS Inc. in Delaware alongside its 11,000-plus stock-keeping-unit portfolio.