










Hy-Tech Engineers Q2 revenue climbs 41%, margin reaches 23.8%
Key highlights
- H-T reported Q2 FY27 revenue of Rs 60.9 crore, up 41% from Rs 43 crore in Q1 FY27.
- Q2 FY27 EBITDA was Rs 14.5 crore and EBITDA margin rose to 23.8% from 19.6% in Q1 FY27.
- Q2 FY27 PAT increased 86% sequentially to Rs 8.5 crore, with PAT margin at 14.0%.
- Overseas markets represented 24.4% of H1 FY27 revenue, and management plans a New Jersey subsidiary and warehouse.
powered by IRIS
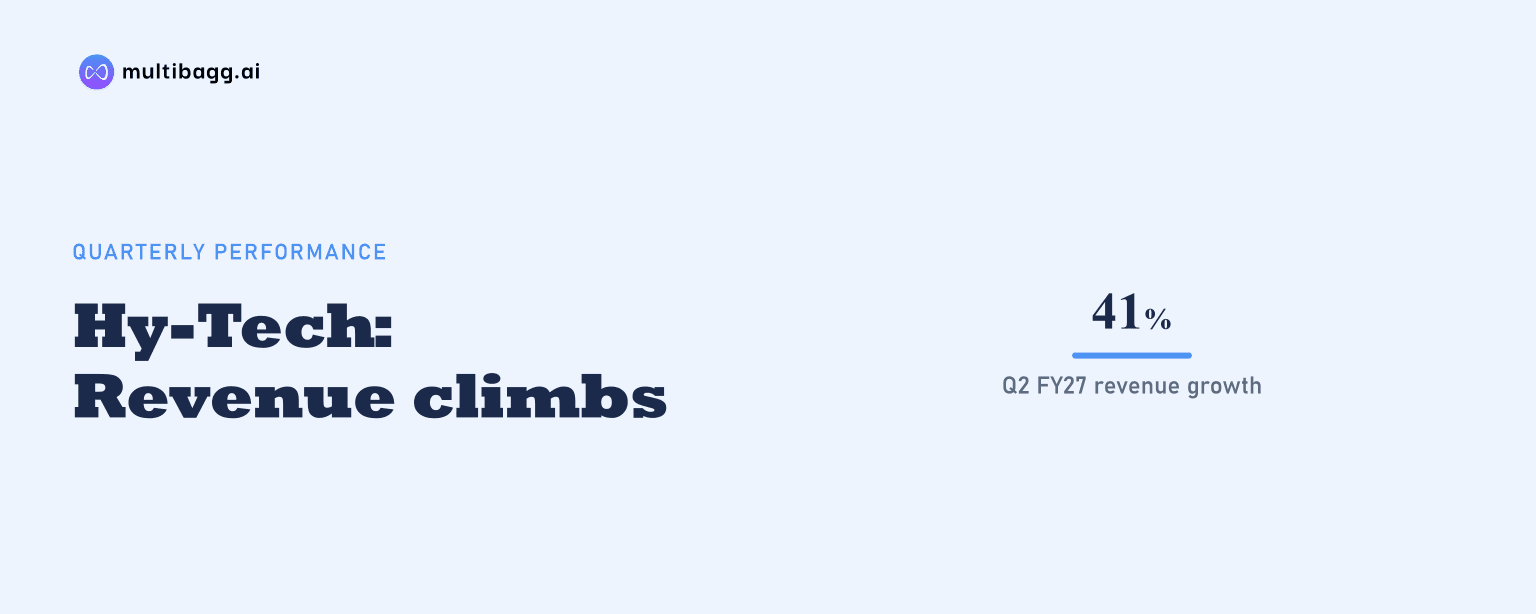
Hy-Tech Engineers reported Q2 FY27 revenue from operations of Rs 60.9 crore, up 41% from Q1 FY27, while earnings before interest, tax, depreciation and amortisation (EBITDA) margin increased to 23.8% from 19.6%. EBITDA rose 72% sequentially to Rs 14.5 crore and profit after tax (PAT) rose 86% to Rs 8.5 crore.
Know Hy-Tech Engineers inside out
Results, valuation, peers and who's buying, in one view.
How did H-T's Q2 FY27 revenue change?
H-T's revenue from operations reached Rs 60.9 crore in Q2 FY27, compared with Rs 43 crore in Q1 FY27 and Rs 49.8 crore in Q2 FY26. The company therefore reported 41% quarter-on-quarter growth and 22% year-on-year growth, with the quarter adding Rs 17.9 crore of revenue from the preceding quarter.
H1 FY27 revenue was Rs 103.9 crore, up 18% from Rs 87.8 crore in H1 FY26. The first-half growth rate was below the 41% sequential increase in Q2, reflecting the lower Q1 FY27 revenue base of Rs 43 crore; the presentation does not provide a full-year revenue target.
Why did H-T's EBITDA margin rise in Q2 FY27?
H-T's EBITDA margin rose by 4.2 percentage points to 23.8% in Q2 FY27 from 19.6% in Q1 FY27, as EBITDA increased by Rs 6.1 crore to Rs 14.5 crore. The Q2 margin was 0.2 percentage points below the 24.0% recorded in Q2 FY26, while quarterly EBITDA was 21% higher year on year.
Operating costs increased alongside sales, although employee-benefit expense declined sequentially. Raw-material consumption rose to Rs 24.6 crore from Rs 17.4 crore, manufacturing expenses increased to Rs 14.2 crore from Rs 11.8 crore, and other expenses rose to Rs 3.7 crore from Rs 2.7 crore; employee benefits fell to Rs 6 crore from Rs 6.8 crore.
H1 FY27 EBITDA was Rs 22.9 crore, 14% above Rs 20.1 crore in H1 FY26, but its margin was 22.1% versus 22.9% a year earlier. Q2 therefore brought the operating margin close to the prior-year quarterly level, whereas the H1 margin remained 0.8 percentage points below the comparable period.
How did H-T's Q2 FY27 net profit compare?
H-T reported Q2 FY27 PAT of Rs 8.5 crore, up 86% from Rs 4.6 crore in Q1 FY27 and 23% from Rs 6.9 crore in Q2 FY26. PAT margin increased to 14.0% from 10.6% sequentially and was 0.2 percentage points above the 13.8% recorded a year earlier.
Profit before tax rose 89% sequentially to Rs 11.5 crore from Rs 6.1 crore. Depreciation and amortisation increased to Rs 2.6 crore from Rs 2.3 crore, finance cost rose to Rs 80 lakh from Rs 50 lakh, and tax expense doubled to Rs 3 crore from Rs 1.5 crore.
For H1 FY27, PAT rose 19% to Rs 13.1 crore from Rs 11 crore in H1 FY26, while PAT margin remained unchanged at 12.6%. H-T also reported H1 return on equity of 17% and return on capital employed of 24%; its capital-employed calculation excludes cash and bank balances at the end of the period.
Got a follow-up? Ask IRIS
What was H-T's H1 FY27 revenue mix?
H-T generated 90.7% of H1 FY27 revenue through direct sales to original equipment manufacturers (OEMs), while distributors accounted for 9.3%. Domestic markets represented 75.6% of revenue and overseas markets accounted for 24.4%, according to the company’s mix disclosure.
Construction machinery was the largest identified industry segment at 22.9%, narrowly ahead of farming at 22.7%. Automotive represented 10.2%, hydraulic systems 6.6%, injection moulding machines 4.8%, and IPE and railways 1.7%; the remaining 31.0% was classified as others, including unidentified sectors sold through distributors.
H-T describes itself as a hydraulic-fittings engineering business with more than 11,000 stock-keeping units, six manufacturing facilities and 170 direct customers including OEMs. It reports installed annual capacity of 483 lakh pieces, an active distributor network of more than seven distributors, and exports to 11 countries.
What do H-T's balance sheet and expansion plans show?
H-T reported total equity of Rs 183.5 crore at September 2026, compared with Rs 122 crore at March 2026, while total borrowings were Rs 5.6 crore. These borrowings comprised Rs 10 lakh of long-term borrowings and Rs 5.5 crore of short-term borrowings, and the company reported a debt-to-equity ratio of 0.03 times for H1 FY27.
Inventory increased to Rs 39.7 crore at September 2026 from Rs 28.4 crore at March 2026, while trade receivables rose to Rs 57.9 crore from Rs 49.9 crore. Net cash from operations was Rs 17.6 crore, cash flow from investing activities was negative Rs 36.6 crore, and cash and cash equivalents ended at Rs 1.5 crore compared with Rs 2.6 crore at the beginning of the period.
Management says it plans to establish a wholly owned subsidiary and warehouse in New Jersey to support its international presence and customer engagement. The plan follows an H1 FY27 overseas revenue mix of 24.4%, but the presentation does not disclose a project cost, opening date or expected revenue contribution.
Conclusion
H-T's Q2 FY27 performance showed sequential gains in revenue, operating profit and net profit, with revenue reaching Rs 60.9 crore, EBITDA reaching Rs 14.5 crore and PAT reaching Rs 8.5 crore. The 23.8% EBITDA margin was 4.2 percentage points above Q1 FY27 and near Q2 FY26's 24.0%, although the H1 FY27 EBITDA margin of 22.1% remained below the prior-year first-half level of 22.9%.
The next disclosed development to watch is management's planned New Jersey subsidiary and warehouse, which is linked to deeper international-market penetration and wider product opportunities. H-T derived 24.4% of H1 FY27 revenue from overseas markets, but management has not provided a timetable, investment amount or financial target for the project.