










Hy-Tech Engineers Limited lifts EBITDA margin to 22% in FY26
Key highlights
- H-T's EBITDA margin increased from 16.4% in FY24 to 22.0% in FY26.
- H-T reported FY26 revenue of Rs 189.4 crore, EBITDA of Rs 41.7 crore and PAT of Rs 22.6 crore.
- H-T's net cash from operations rose to Rs 38.6 crore in Mar-26 from Rs 23 crore in Mar-25.
- H-T's debt-to-equity ratio declined to 0.24x in FY26 from 0.50x in FY24.
powered by IRIS
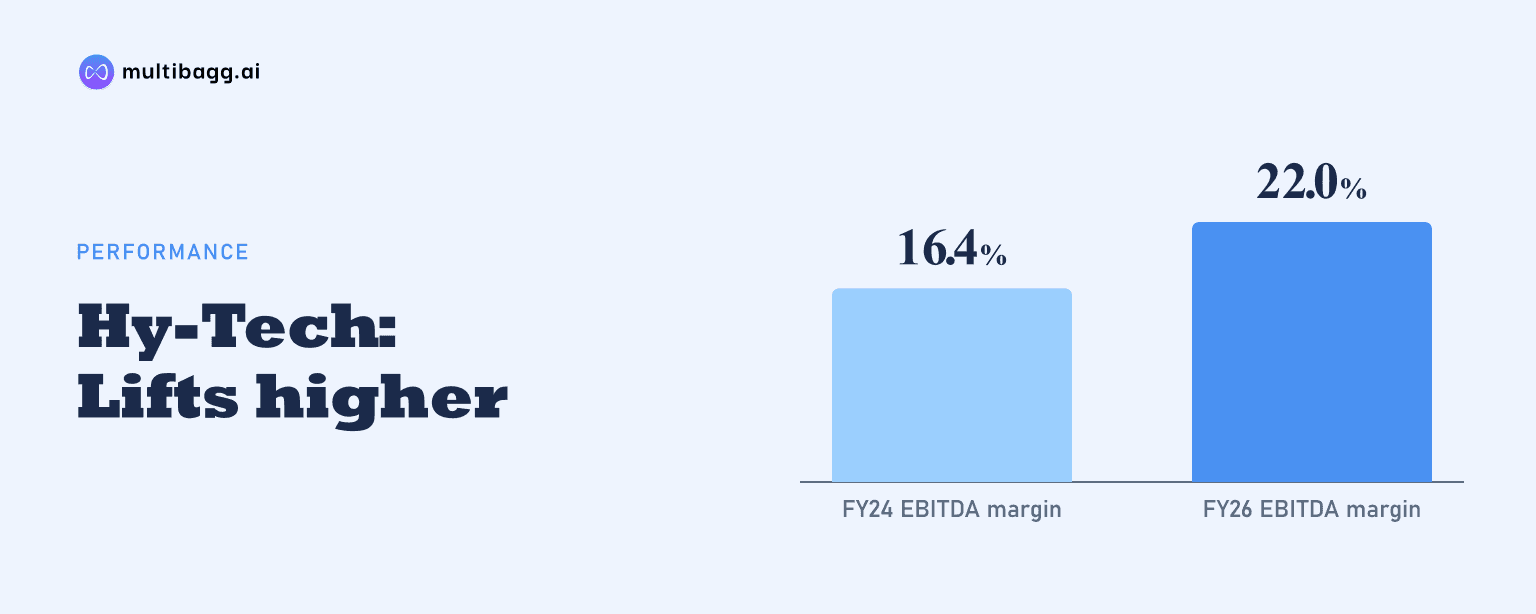
Hy-Tech Engineers Limited reported a 22.0% earnings before interest, tax, depreciation and amortisation (EBITDA) margin in FY26, compared with 16.4% in FY24, while debt-to-equity declined from 0.50x to 0.24x. Revenue reached Rs 189.4 crore and profit after tax (PAT) was Rs 22.6 crore in FY26.
Know Hy-Tech Engineers inside out
Results, valuation, peers and who's buying, in one view.
How did H-T expand profitability?
H-T increased EBITDA to Rs 41.7 crore in FY26 from Rs 22.6 crore in FY24, while revenue from operations rose to Rs 189.4 crore from Rs 137.7 crore. The presentation reports a 36% compound annual growth rate (CAGR) for EBITDA over the period, compared with 17% for revenue, alongside a 5.6-percentage-point increase in EBITDA margin.
The margin gain was concentrated in FY25 and was largely maintained in FY26. EBITDA margin rose to 22.2% in FY25 from 16.4% in FY24, then moved to 22.0% in FY26. PAT margin followed the same pattern, increasing from 8.4% in FY24 to 12.2% in FY25 before easing to 11.9% in FY26.
FY26 revenue was Rs 28 crore higher than FY25, while EBITDA rose Rs 5.9 crore and PAT increased Rs 3 crore. H-T reported a 40% PAT CAGR from FY24 to FY26, faster than its reported revenue CAGR, with PAT increasing from Rs 11.6 crore to Rs 22.6 crore.
What changed in H-T's costs and operating profit?
H-T reported Rs 41.7 crore of EBITDA on FY26 revenue of Rs 189.4 crore after recording Rs 67.3 crore of raw-material and component consumption, Rs 45.8 crore of manufacturing and operating expenses, Rs 23.4 crore of employee-benefit expense and Rs 12.6 crore of other expenses.
Between FY25 and FY26, raw-material and component consumption increased Rs 8.1 crore, manufacturing and operating expenses increased Rs 7.3 crore, employee costs rose Rs 3.1 crore and other expenses rose Rs 1.7 crore. Over the same period, revenue increased Rs 28 crore and EBITDA increased Rs 5.9 crore; the presentation does not attribute the margin movement to a specific cost line.
Below EBITDA, depreciation and amortisation was Rs 10.7 crore in FY26, compared with Rs 10.1 crore in FY25 and Rs 7.3 crore in FY24. Finance cost declined to Rs 4.5 crore from Rs 4.8 crore in FY25, while profit before tax reached Rs 30.6 crore, against Rs 26.2 crore a year earlier.
How did H-T's cash generation and returns change?
H-T generated Rs 38.6 crore of net cash from operations in Mar-26, compared with Rs 23 crore in Mar-25 and Rs 24 crore in Mar-24. FY26 operating cash flow was Rs 16 crore above FY26 PAT of Rs 22.6 crore, although the presentation does not provide a reconciliation for the difference.
Cash flow from investing activities was an outflow of Rs 7.2 crore in Mar-26, lower than the Rs 13.4 crore outflow in Mar-25 and Rs 35.5 crore in Mar-24. Financing activities used Rs 21.3 crore in Mar-26, compared with an outflow of Rs 3.5 crore in Mar-25 and an inflow of Rs 16.6 crore in Mar-24; closing cash and cash equivalents rose to Rs 2.6 crore from Rs 70 lakh.
Return on equity was 19.0% in FY26, unchanged from FY25 and above 14.0% in FY24. Return on capital employed rose from 18.0% in FY24 to 24.0% in FY25 and 25.0% in FY26, while net worth increased from Rs 82.2 crore to Rs 122 crore over the two years.
Got a follow-up? Ask IRIS
How far did H-T reduce leverage?
H-T reduced its debt-to-equity ratio to 0.24x in FY26 from 0.43x in FY25 and 0.50x in FY24. The FY24-to-FY26 decline of 0.26x occurred as total equity rose by Rs 39.8 crore, from Rs 82.2 crore to Rs 122 crore.
Long-term borrowings decreased to Rs 17.1 crore in Mar-26 from Rs 22.9 crore in Mar-25, while short-term borrowings fell to Rs 12.6 crore from Rs 20.6 crore. Combined borrowings across those two disclosed lines were Rs 29.7 crore in Mar-26, compared with Rs 43.5 crore a year earlier.
Working-capital balances increased alongside revenue. Trade receivables were Rs 49.9 crore in Mar-26, up from Rs 45.7 crore in Mar-25 and Rs 36.9 crore in Mar-24, while inventories rose to Rs 28.4 crore from Rs 26.7 crore and Rs 21 crore, respectively.
What does H-T's revenue mix show?
H-T derived 88.4% of revenue through direct sales to original equipment manufacturers (OEMs), with distributors contributing 11.6%. Repeat customers accounted for 95.1% of revenue and new customers for 4.9%, according to the presentation's revenue-base analysis.
Domestic revenue represented 70.6% of the total and overseas revenue represented 29.4%. Construction machinery was the largest identified industry segment at 22.9%, narrowly ahead of farming at 22.8%; automotive accounted for 9.1%, hydraulic systems for 5.1% and injection moulding machines for 4.0%.
The largest category was Others at 34.4%, defined by H-T as unidentified sectors sold through distributors. Industrial process equipment and railways accounted for 1.5% and parking systems for 0.3%; the company also cited an 11,000-plus stock-keeping unit portfolio at bauma CONEXPO INDIA 2026.
Conclusion
H-T's FY24-to-FY26 record shows revenue rising from Rs 137.7 crore to Rs 189.4 crore while EBITDA margin increased 5.6 percentage points to 22.0%. EBITDA and PAT grew faster than revenue, operating cash flow reached Rs 38.6 crore in Mar-26 and debt-to-equity fell to 0.24x.
What to watch next is management's execution of its disclosed plan to expand capacity at Shirwal, Kavath and Pithampur Unit-I, grow domestic and international distribution, and develop its United States presence through HY-TECH ENGINEERS Inc. H-T also plans to pursue railway and defence applications and evaluate valves as an adjacent category.