










Indian Initial Public Offerings: 30-50x P/E gained 19.08%
Key highlights
- IPOs valued at 30-50 times P/E averaged a 19.08% listing gain across 21 issues.
- IPOs priced above 50 times P/E averaged only a 1.92% listing gain across 15 issues.
- 185 of 307 IPOs with available listing prices, or 60.3%, listed above issue price as of 10 November 2026.
- Average IPO P/E multiples declined from 69.46 times in 2025 to 41.69 times in 2026.
powered by IRIS
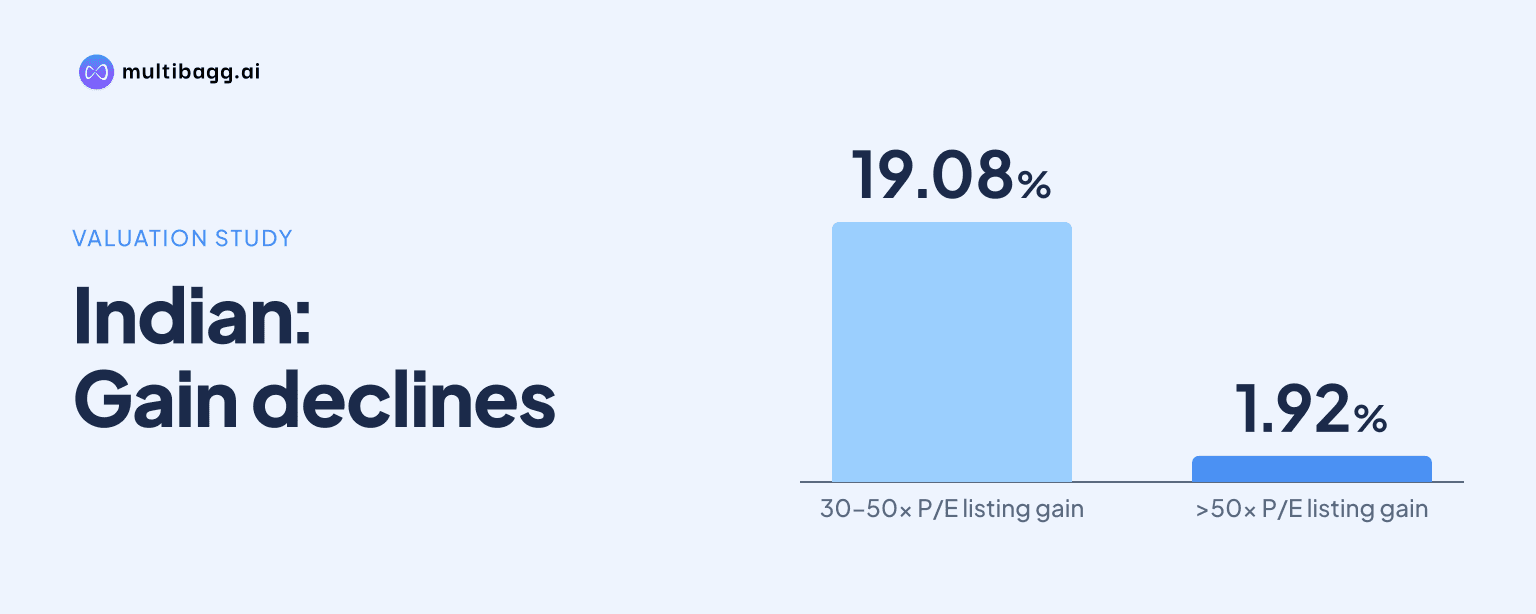
Indian Initial Public Offerings valued at 30-50 times earnings recorded the strongest average listing gain of 19.08% in the January-September 2026 valuation study, ahead of lower-P/E offerings and far above the 1.92% average gain for IPOs priced above 50 times earnings. The figures show that higher valuations did not reliably translate into better listing-day returns.
Which IPO valuation band delivered the best listing gains?
Indian IPOs in the 30-50 times price-to-earnings, or P/E, band delivered the best average listing gain, at 19.08%. The group contained 21 issues, and 66.67% of them listed at a premium to their offer price. This was the highest average among the 238 IPOs with reported P/E ratios in the study covering January to September 2026.
The result matters because it challenges a simple assumption that the cheapest IPOs should always generate the largest debut gains. IPOs below 15 times earnings did produce a strong average gain of 16.19%, but they did not lead the sample. The 30-50 times group also had a median listing premium of 23.2%, indicating that a substantial part of its return was realised at the market debut rather than after listing.
Why did IPOs above 50 times P/E lag the market?
Indian IPOs priced above 50 times earnings averaged only a 1.92% listing gain, the weakest outcome among the reported valuation bands. Only 46.67% of the 15 issues in this group listed above their issue price, compared with 66.67% in the 30-50 times group and 65.65% among issues below 15 times earnings.
The comparison points to the limits of a high valuation at the offer stage. A premium P/E multiple did not assure strong debut demand in the data. Average IPO P/E multiples nevertheless fell from 69.46 times in 2025 to 41.69 times in 2026, a decline of nearly 40%, as investors prioritised valuations, profitability and earnings visibility amid market uncertainty.
Do lower-priced IPOs always provide better listing returns?
Indian IPOs with lower P/E multiples did not consistently provide better listing returns, although the below-15-times group remained comparatively strong. Its 16.19% average gain across 131 issues exceeded the 8.25% average for the 71 IPOs valued at 15-30 times earnings, but trailed the 19.08% gain in the 30-50 times range.
That non-linear pattern is important for investors assessing an offer price. A low P/E may be relevant, but it is not a standalone signal for listing-day performance. Social-media discussions around 2026 IPOs have also highlighted issue structure, including the split between an offer for sale and a fresh issue, alongside peer valuation comparisons using P/E and EV/EBITDA ratios.
Got a follow-up? Ask IRIS
How broad were IPO listing gains across the Indian market?
Indian IPO listing performance was positive for a majority of issues, but gains were uneven across mainboard and SME listings. As of 10 November 2026, 308 IPOs had listed on the NSE and BSE, comprising 116 mainboard and 192 SME issues. Their average listing-day gain was 12.86%, while the median was a much lower 3.03%, showing that a smaller set of large gains lifted the average.
Of the 307 issues with a listing price, 185, or 60.3%, listed above their issue price. Mainboard issues had a higher premium-listing rate of 69.6%, compared with 54.7% for SMEs. Mainboard listings also reported an average gain of 13.87% and a median gain of 6.67%, versus 12.26% and 1.17%, respectively, for SME listings.
What do listing gains say about returns after the debut?
Indian IPO listing gains measure opening or listing-day demand and do not by themselves establish long-term shareholder returns. In the 30-50 times P/E group, the median return was 58.8% in a separate analysis, but the median listing premium was already 23.2% and the additional post-listing gain was 10.5%.
Broader market data reinforce the distinction between a strong debut and subsequent performance. Of the 306 IPOs with a current price available as of 9 November, 137, or 44.8%, traded below their issue price. This total included 49 issues that had initially listed above their offer price, underscoring that a premium debut did not prevent later weakness.
Conclusion
The 2026 valuation data suggests that IPO listing performance was strongest in the middle of the reported P/E range, not at the lowest or highest valuations. The 30-50 times band led with a 19.08% average gain, while issues above 50 times returned only 1.92% on average. Investors therefore cannot treat either a low offer valuation or a premium listing as a complete investment case.
The next point to watch is whether newly listed shares sustain their issue-price gains, particularly as 44.8% of tracked IPOs with current prices were below their offer price by 9 November 2026. Retail investors can compare an IPO's P/E and EV/EBITDA ratios with listed peers, examine the fresh-issue versus offer-for-sale mix, and separate expected listing demand from longer-term earnings visibility.