










NIFTY 50 Breakout Above 25,000 Faces 25,800 Test
Key highlights
- NIFTY 50 rose 8.58% during the week and closed above 25,000.
- Nifty's key resistance range is 25,350-25,800, according to the cited technical outlook.
- The daily RSI was cited at around 77.42, indicating overbought conditions.
- Nifty's broader breakout support zone is identified at 24,000-24,400.
powered by IRIS
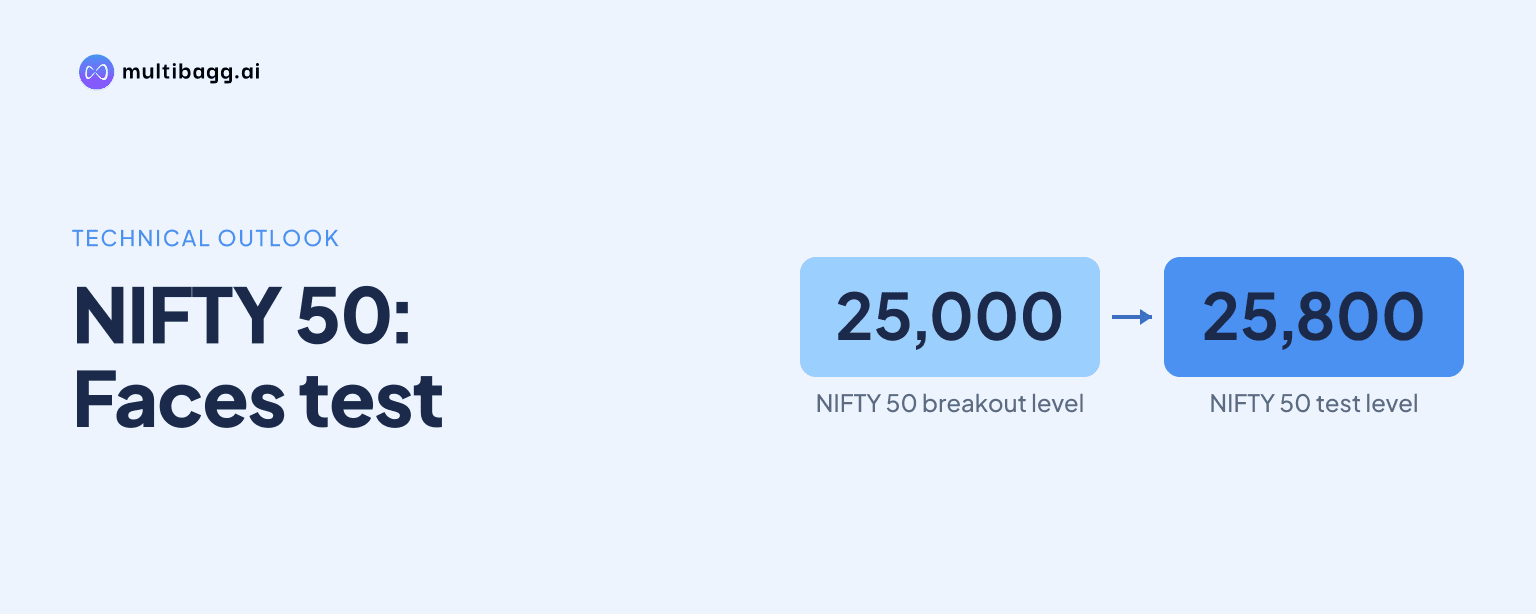
NIFTY 50 closed above 25,000 after rising 8.58% during the week, validating a breakout above 25,131.85, but the index must clear the 25,350-25,800 resistance band to extend the bullish move. Technical discussions point to improving momentum, while also warning that elevated volatility and profit booking could interrupt the advance.
Has Nifty confirmed a bullish breakout?
Yes, Nifty has shown several technical signs associated with a bullish breakout, including a close above 25,000 and a move above an earlier declining trendline. Market commentary also described the index as having reclaimed key short-, medium- and long-term moving averages and important swing levels.
The breakout is being viewed alongside a falling-wedge formation on the daily chart. This pattern was described as a contraction in selling pressure, with lower highs and lower lows forming between converging downward trendlines. Nifty also moved above the wedge's upper boundary and reclaimed the Ichimoku cloud after finding support near 22,200, according to the shared technical analysis.
Another positive point cited in market discussions is Nifty's fourth consecutive weekly close above the previous week's swing high. That sequence has been interpreted as evidence that the current bullish move remains intact. However, technical patterns provide levels to monitor rather than certainty about the direction or duration of a rally.
Which Nifty levels matter after the move above 25,000?
Nifty's immediate upside test is the 25,350-25,800 resistance range, while 24,000-24,400 is a key support area for the current breakout structure. The resistance zone has been identified by market experts as the hurdle that must be crossed on a sustained basis for momentum to continue.
Other shorter-term levels mentioned in the discussion include 25,250 as immediate resistance and 24,775 as immediate support. A separate intraday framework treats 25,131.85 as a breakout-validation level: a pullback that holds above it would turn previous resistance into structural support, while a deep fall back into the earlier channel would weaken the immediate breakout case.
Can Nifty move towards 25,500 or 25,800?
Nifty could move towards 25,500 and then 25,800 if it sustains above the identified resistance levels, according to the technical outlooks shared online. Analysts cited targets of 25,350, 25,500 and 25,600 in the near term, with 25,800 presented as the upper end of the immediate resistance range.
The move above 25,000 came with a strong weekly advance, and one analysis described a long bullish Marubozu-like weekly candlestick. The same commentary noted a bullish RSI crossover. These observations support the case for continued buying interest, but they do not remove the prospect of consolidation after a sharp rise.
The daily RSI was cited at around 77.42, which places it in overbought territory. An overbought reading does not necessarily signal an immediate reversal, but it suggests that the pace of the rally may be difficult to maintain without a pause. The market's ability to absorb profit booking while holding recently reclaimed levels is therefore central to the next phase.
Got a follow-up? Ask IRIS
What could weaken the current Nifty setup?
A failure to hold above 24,900 could lead Nifty to retest 24,800, and a break below 24,800 could open the way towards 24,500-24,400. This is the downside scenario outlined in the provided market analysis if profit booking moves beyond a routine consolidation.
The short-term support levels have varied across the technical commentaries, reflecting different chart timeframes. Some analysts placed support at 24,800 and 24,300, while others focused on 24,000-24,400. One longer-term view cited 23,600-23,800 as a confluence area of the 200-day EMA and the weekly breakout zone. For traders, the distinction is important: a modest dip can coexist with a positive broader trend, while repeated failures at support would challenge the breakout.
The discussion also points to external factors that may influence sentiment. Improving foreign capital flows and easing oil prices were cited as supportive conditions, as lower energy costs could reduce inflation pressure and help corporate profitability. At the same time, crude oil changes and foreign institutional investor activity remain variables that can alter market direction.
What events could drive Nifty's next move?
India's October inflation release on November 12, US and China inflation data, remaining September-quarter earnings, crude oil moves and foreign institutional investor flows are the next stated drivers for Nifty. These events may determine whether the market can build on its technical recovery or pauses after the recent advance.
The index's immediate price behaviour around 25,000 and the 25,100-25,200 area will also be closely watched. Commentary indicated that a convincing move through this region could revive buying momentum, whereas an inability to sustain higher levels could bring consolidation. Bank Nifty's cited potential move towards 60,200 is another related market signal being tracked by participants.
Conclusion
Nifty's close above 25,000 and its 8.58% weekly gain have strengthened the bullish technical case, supported by the break above a declining trendline, reclaimed moving averages and the reported falling-wedge breakout. Still, the elevated RSI and repeated warnings about volatility mean the move may include profit-taking rather than proceed in a straight line.
The next key test is whether Nifty can sustain above 25,350-25,800, with 24,000-24,400 remaining important support for the broader breakout structure. Investors will watch the November 12 inflation release, global inflation data, pending September-quarter earnings, crude oil and foreign institutional investor activity for signals on whether the recovery can extend.