










Indian Oil operating cash flow falls 68% to Rs 9,872.58 crore
Key highlights
- Indian Oil’s net operating cash flow fell 68% to Rs 9,872.58 crore in the six months ended 30 September 2026 from Rs 31,275.98 crore a year earlier.
- Working capital absorbed Rs 22,566.08 crore, led by a Rs 38,069.07 crore inventory outflow and an Rs 8,956.98 crore outflow from trade and other receivables.
- Standalone profit after tax rose to Rs 18,968.66 crore from Rs 13,295.05 crore, despite the decline in operating cash flow.
- Cash and cash equivalents fell to Rs 90.39 crore at 30 September 2026 from Rs 281.41 crore at 31 March 2026.
powered by IRIS
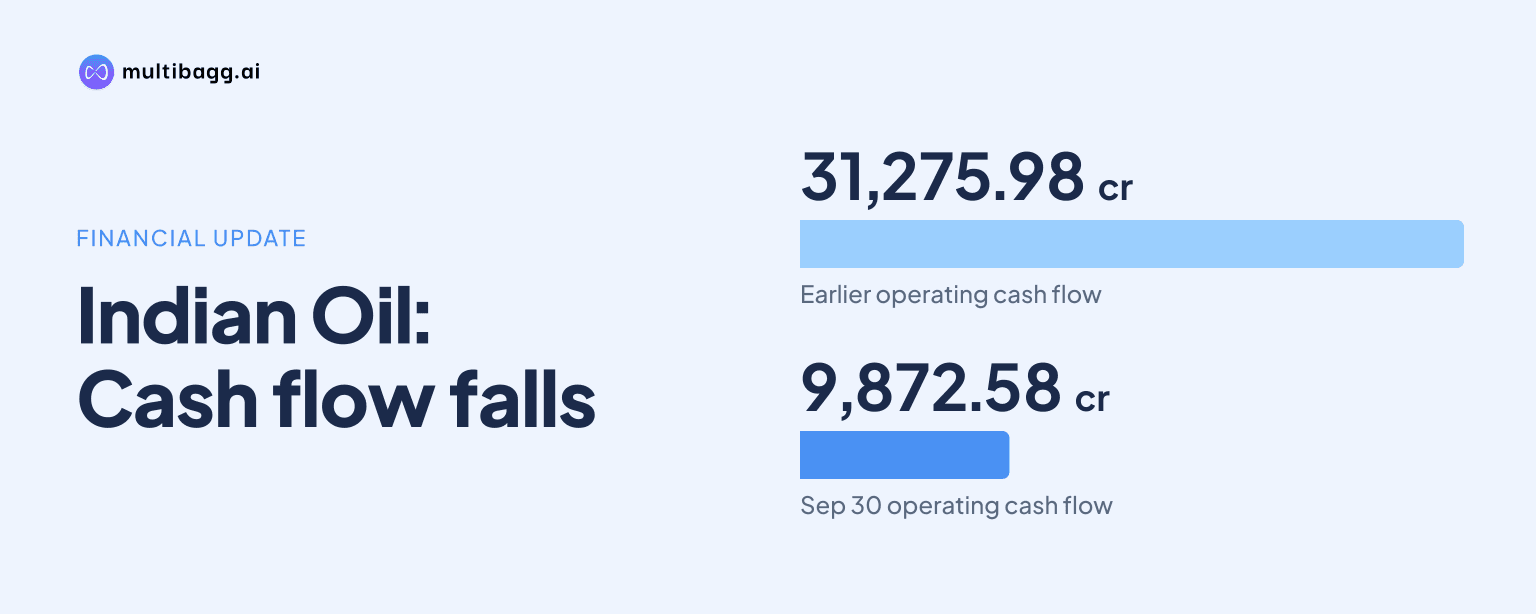
Indian Oil Corporation Limited reported standalone net cash flow from operating activities of Rs 9,872.58 crore for the six months ended 30 September 2026, 68% below Rs 31,275.98 crore a year earlier. A Rs 38,069.07 crore inventory cash outflow and a Rs 8,956.98 crore outflow on trade and other receivables outweighed higher operating profit and payables.
Know Indian Oil Corporation inside out
Results, valuation, peers and who's buying, in one view.
Why did Indian Oil’s operating cash flow decline?
Indian Oil’s operating cash flow declined because working capital absorbed Rs 22,566.08 crore during the six months ended 30 September 2026, against a Rs 4,393.42 crore working-capital inflow in the corresponding 2025 period. Cash generated from operations before tax payments fell to Rs 10,479.04 crore from Rs 34,241.07 crore despite higher operating profit before working-capital changes.
Inventories were the largest cash use, absorbing Rs 38,069.07 crore after contributing Rs 168.86 crore in the prior-year half. Trade and other receivables absorbed a further Rs 8,956.98 crore, compared with Rs 791.89 crore a year earlier. Trade and other payables partly offset those outflows, adding Rs 24,459.97 crore of cash, versus Rs 5,016.45 crore in the previous period.
How much did inventories and receivables increase at Indian Oil?
Indian Oil’s inventory balance increased by Rs 38,062.59 crore between 31 March 2026 and 30 September 2026, while trade receivables increased by Rs 9,741.69 crore. Inventories stood at Rs 145,546.71 crore at the September reporting date, compared with Rs 107,484.12 crore at March-end, and trade receivables were Rs 23,970.84 crore against Rs 14,229.15 crore.
The cash-flow statement uses different categories from the balance sheet, grouping trade and other receivables together while recording inventory movements separately. It reports a Rs 8,956.98 crore cash outflow from trade and other receivables and a Rs 38,069.07 crore outflow from inventories. These movements occurred as revenue from operations rose 28% year on year to Rs 538,907.35 crore for the half year from Rs 421,600.04 crore.
Inventory turnover was 4.18 times for the six months ended 30 September 2026, compared with 3.97 times in the corresponding 2025 period. Trade receivables turnover was 27.69 times, up from 23.10 times. Indian Oil marked both half-year turnover measures as not annualised.
Did Indian Oil remain profitable despite lower cash generation?
Indian Oil remained profitable, reporting standalone profit after tax of Rs 18,968.66 crore for the six months ended 30 September 2026, up from Rs 13,295.05 crore a year earlier. Profit before tax increased to Rs 23,342.32 crore from Rs 17,470.48 crore, while cash generation moved in the opposite direction because of the working-capital outflow.
Operating profit before working-capital changes rose by Rs 3,197.47 crore to Rs 33,045.12 crore from Rs 29,847.65 crore. The cash-flow reconciliation included Rs 8,013.53 crore of depreciation, amortisation and impairment and Rs 3,974.27 crore of finance costs. The Rs 22,566.08 crore working-capital outflow then reduced cash generated from operations to Rs 10,479.04 crore.
The Petroleum Products segment reported Rs 22,062.45 crore of profit before tax, interest income, finance costs, dividend and exceptional items in the half year, compared with Rs 20,406.76 crore a year earlier. Petrochemicals contributed Rs 745.25 crore, Gas contributed Rs 1,763.72 crore, and Other Business Activities contributed Rs 272.82 crore. These segment results are measured before corporate finance costs and unallocated items.
Got a follow-up? Ask IRIS
What happened to Indian Oil’s cash, investment and financing flows?
Indian Oil’s cash and cash equivalents fell to Rs 90.39 crore at 30 September 2026 from Rs 281.41 crore at 31 March 2026, a reduction of Rs 191.02 crore. Net operating cash inflow of Rs 9,872.58 crore was more than offset by Rs 8,494.14 crore used in investing activities and Rs 1,569.46 crore used in financing activities.
Investing outflows included Rs 9,046.26 crore spent on construction work in progress and Rs 1,852.19 crore spent on property, plant, equipment and intangible assets. Construction work-in-progress expenditure was lower than Rs 13,519.96 crore in the prior-year half, while Indian Oil also invested Rs 541.24 crore in joint ventures and associates. Net investing cash outflow narrowed from Rs 12,587.71 crore a year earlier.
Financing activities used Rs 1,569.46 crore, compared with Rs 18,905.06 crore used in the corresponding 2025 half. Indian Oil raised Rs 9,079.01 crore in long-term borrowings and repaid Rs 2,265.88 crore, while short-term borrowings declined by Rs 1,490.95 crore. Interest paid was Rs 3,679.42 crore and lease-liability payments were Rs 1,487.40 crore.
How did Indian Oil’s balance sheet change by September 2026?
Indian Oil’s current assets rose to Rs 187,616.40 crore at 30 September 2026 from Rs 141,146.07 crore at 31 March 2026, while current liabilities increased to Rs 232,279.97 crore from Rs 200,847.83 crore. The current ratio, defined by Indian Oil as current assets divided by current liabilities, was 0.81 times at September-end compared with 0.70 times at March-end.
Current borrowings increased by Rs 6,071.21 crore to Rs 64,359.25 crore, whereas non-current borrowings were Rs 52,218.77 crore, compared with Rs 52,380.18 crore at March-end. Total equity increased to Rs 217,380.26 crore from Rs 204,544.34 crore. The debt-equity ratio was 0.54 times at 30 September 2026, unchanged from 31 March 2026.
Indian Oil also reported a cumulative net negative buffer of Rs 32,505.69 crore on domestic liquefied petroleum gas, or LPG, at 30 September 2026. It recognised Rs 7,243.02 crore as revenue from operations for April to September 2026 under a government-approved compensation mechanism, reducing the buffer by that amount.
Conclusion
Indian Oil’s half-year results show that higher revenue and profit did not translate into comparable operating cash generation. The rise in inventory and receivables absorbed more cash than the increase in payables supplied, leaving net operating cash flow at Rs 9,872.58 crore even as profit after tax reached Rs 18,968.66 crore.
The next disclosures will show whether the Rs 145,546.71 crore inventory balance and Rs 23,970.84 crore receivables balance reverse or continue to absorb cash. Indian Oil also disclosed that mandatory board committees had not been reconstituted following the absence of an independent director from 28 March 2026, leaving an unresolved governance matter at the reporting date.