










IndianOil FY26 profit rebounds to Rs 36,802 crore as payout falls
Key highlights
- IndianOil’s FY26 net profit rose to Rs 36,802 crore from Rs 12,962 crore in FY25.
- FY26 EBITDA increased to Rs 73,718 crore from Rs 38,060 crore a year earlier.
- Total equity reached Rs 2,04,544 crore in FY26, up Rs 25,867 crore year on year.
- IndianOil’s FY26 payout ratio fell to 31% from 32% in FY25, despite a Rs 23,840 crore increase in profit.
powered by IRIS
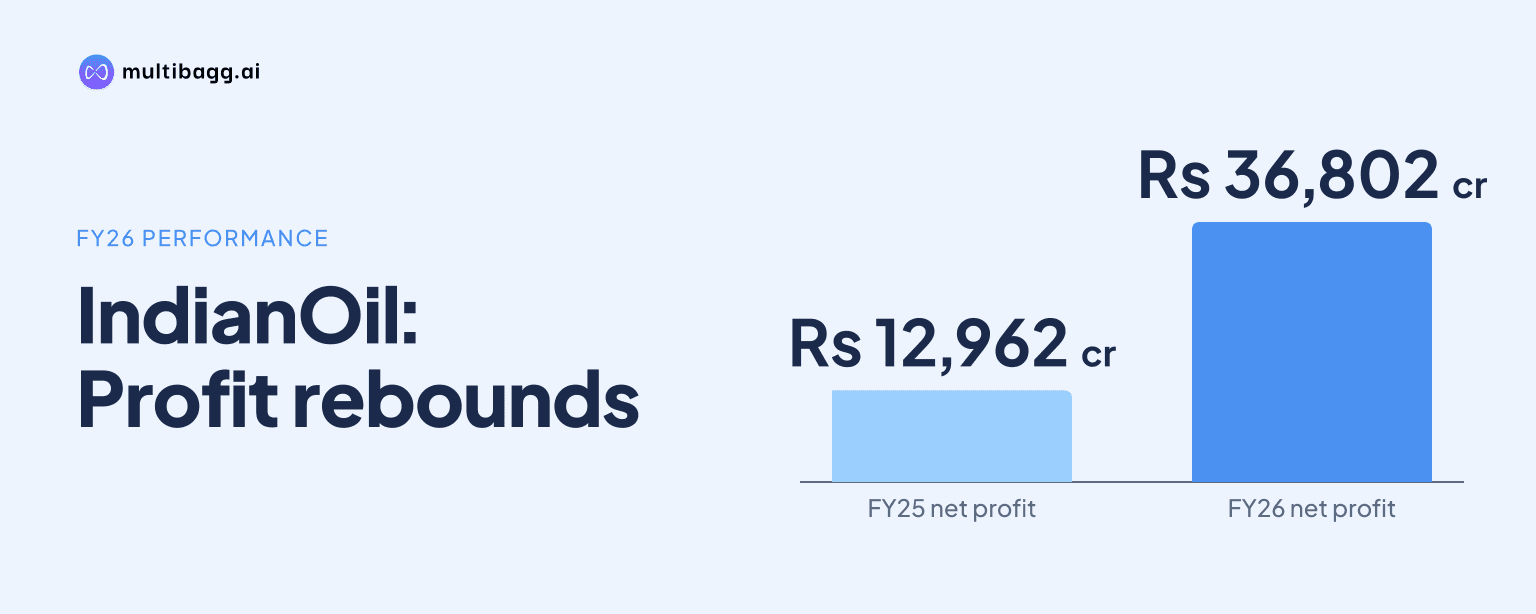
IndianOil reported net profit of Rs 36,802 crore in FY 26, compared with Rs 12,962 crore in FY 25, while earnings before interest, tax, depreciation and amortisation (EBITDA) rose to Rs 73,718 crore. Its dividend payout ratio nevertheless declined to 31% from 32%, and total equity reached Rs 2,04,544 crore.
Know Indian Oil Corporation inside out
Results, valuation, peers and who's buying, in one view.
What was IndianOil's FY 26 net profit?
IndianOil's FY 26 net profit was Rs 36,802 crore, an increase of Rs 23,840 crore from Rs 12,962 crore in FY 25. The FY 26 outcome was also Rs 2,817 crore below the five-year high of Rs 39,619 crore recorded in FY 24. Revenue from operations increased to Rs 8,86,224 crore in FY 26 from Rs 8,45,513 crore in FY 25, a rise of Rs 40,711 crore.
EBITDA was Rs 73,718 crore in FY 26, up Rs 35,658 crore from Rs 38,060 crore a year earlier. The increases in revenue, net profit and EBITDA distinguish FY 26 from FY 25 in the five-year presentation. FY 26 revenue remained Rs 48,729 crore below the FY 23 level of Rs 9,34,953 crore, meaning the profit rebound occurred without revenue returning to its five-year peak.
How volatile have IndianOil's earnings been?
IndianOil's five-year record shows substantial movement in both net profit and EBITDA rather than a consistent annual progression. Net profit declined from Rs 24,184 crore in FY 22 to Rs 8,242 crore in FY 23, rose to Rs 39,619 crore in FY 24, fell to Rs 12,962 crore in FY 25 and recovered to Rs 36,802 crore in FY 26. The presentation attributes the FY 23 result to suppressed marketing margins.
IndianOil's FY 26 EBITDA was Rs 464 crore below FY 24's Rs 74,182 crore, while FY 26 net profit was Rs 2,817 crore below the FY 24 figure. In contrast, FY 23 combined the highest revenue in the series, Rs 9,34,953 crore, with the lowest EBITDA, Rs 28,488 crore, and the lowest net profit, Rs 8,242 crore. The comparison shows that revenue did not move in line with the reported earnings measures in every year.
How did IndianOil allocate FY 26 profit?
IndianOil reported a dividend payout ratio of 31% of profit after tax (PAT) for FY 26, down one percentage point from 32% in FY 25. The presentation identifies the measure as the dividend payout ratio, showing the reported share of PAT distributed as dividends rather than an absolute rupee dividend. FY 26 profit increased by Rs 23,840 crore year on year even as the reported ratio declined.
The FY 26 payout ratio was below each of the preceding three reported years: 42% in FY 24, 50% in FY 23 and 48% in FY 22. From the five-year high of 50% in FY 23 to 31% in FY 26, the ratio declined by 19 percentage points. Over the same interval, total equity increased from Rs 1,34,758 crore to Rs 2,04,544 crore, although the presentation does not break down the drivers of that equity increase.
Got a follow-up? Ask IRIS
How did IndianOil's equity and capex compare?
IndianOil's total equity rose to Rs 2,04,544 crore in FY 26 from Rs 1,78,677 crore in FY 25, an increase of Rs 25,867 crore. It was Rs 73,258 crore higher than the Rs 1,31,286 crore reported in FY 22. The largest year-on-year increase in the displayed period occurred in FY 24, when total equity reached Rs 1,76,715 crore from Rs 1,34,758 crore in FY 23.
IndianOil reported provisional capital expenditure of Rs 12,162 crore during H1 FY 2026-27, against a full-year FY 2026-27 capex target of Rs 32,700 crore. Refinery capex was Rs 6,083 crore, the largest disclosed segment, followed by marketing at Rs 3,396 crore and petrochemicals at Rs 1,306 crore. Based on the reported figures, H1 capex represented about 37% of the stated annual target.
What projects is IndianOil progressing toward completion?
IndianOil listed three refinery expansion projects with December 2026 expected completion dates: Panipat, Gujarat and Barauni. Panipat Refinery Expansion, from 15 million metric tonnes per annum (MMTPA) to 25 MMTPA, had a gross approved cost of Rs 38,231 crore and 95.0% physical progress as of 30 September 2026. Gujarat Refinery Expansion was 90.1% complete at a gross approved cost of Rs 18,936 crore, while Barauni Refinery Expansion was 92.5% complete with Rs 18,113 crore approved.
IndianOil reported that the PX-PTA complex at Paradip Refinery was mechanically completed in September 2026 and was under commissioning, with a gross approved cost of Rs 13,805 crore. The new Mundra-Panipat crude oil pipeline, with Rs 9,028 crore approved, was mechanically completed in July 2026 and was also under commissioning. These disclosed projects place the FY 2026-27 capex target alongside refinery, petrochemical and pipeline execution rather than a stated dividend-policy target.
Conclusion
IndianOil's FY 26 figures show a marked recovery from FY 25: net profit rose from Rs 12,962 crore to Rs 36,802 crore and EBITDA increased from Rs 38,060 crore to Rs 73,718 crore. At the same time, the dividend payout ratio moved down to 31%, while total equity reached Rs 2,04,544 crore. The five-year record also shows that profit, EBITDA and revenue have not moved uniformly from one financial year to the next.
The next disclosed markers are the FY 2026-27 capex target of Rs 32,700 crore and the scheduled December 2026 completion dates for the Panipat, Gujarat and Barauni refinery expansions. IndianOil also reported the Paradip PX-PTA complex and Mundra-Panipat crude pipeline as under commissioning after mechanical completion in September 2026 and July 2026, respectively. Progress against those milestones and the remaining capex programme are the stated developments to watch.