










IndianOil Q2 volumes fall despite higher LPG, petrochemicals
Key highlights
- IndianOil refinery throughput fell 1.1 MMT sequentially to 18.1 MMT in Q2 FY 2026-27.
- IndianOil pipeline throughput declined 3.2 MMT to 25.3 MMT, while capacity utilisation fell to 64.3% from 79.9%.
- IndianOil total sales decreased 0.983 MMT to 25.228 MMT despite LPG sales rising 0.385 MMT to 3.470 MMT.
- IndianOil’s Panipat, Gujarat and Barauni refinery expansions were 95.0%, 90.1% and 92.5% complete, respectively, as of 30 September 2026.
powered by IRIS
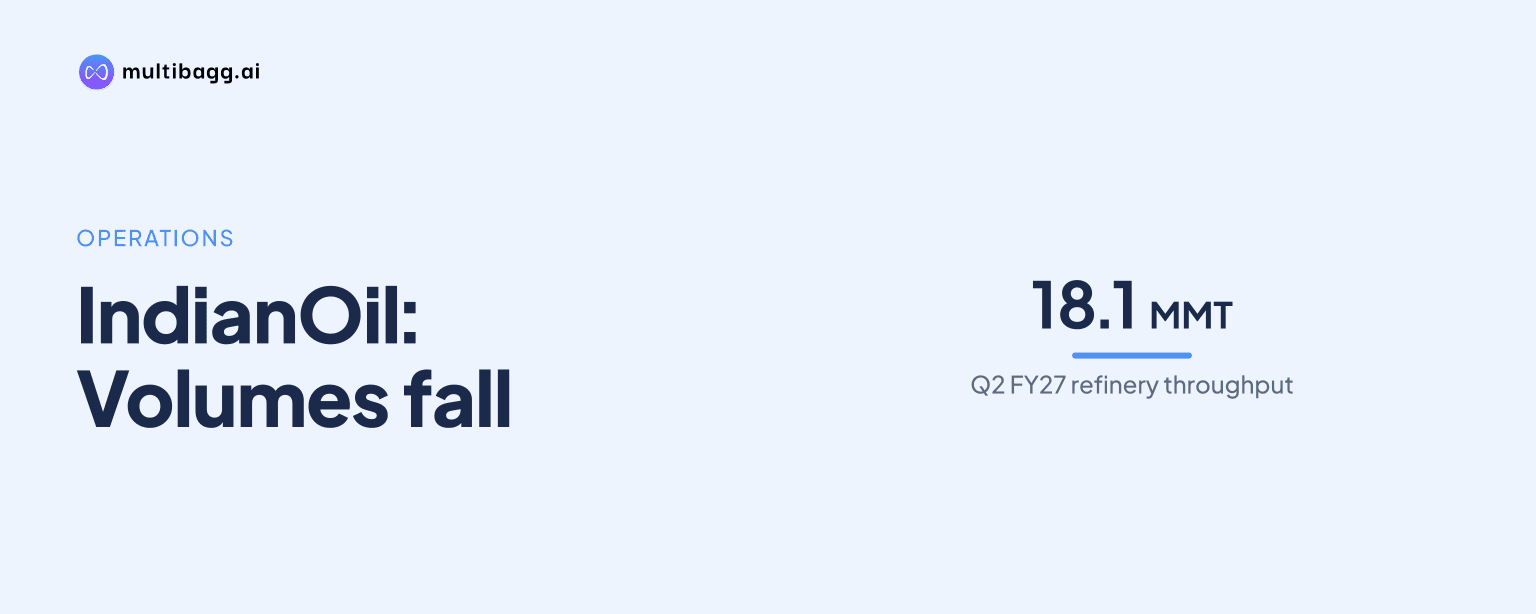
Indian Oil Corporation Limited reported lower sequential refinery, pipeline and total-sales volumes in Q2 FY 2026-27. IndianOil’s refinery throughput declined by 1.1 million metric tonnes (MMT) to 18.1 MMT, pipeline throughput fell 3.2 MMT to 25.3 MMT, and total sales decreased 0.983 MMT to 25.228 MMT, despite higher liquefied petroleum gas (LPG) and petrochemical sales.
Know Indian Oil Corporation inside out
Results, valuation, peers and who's buying, in one view.
What changed in IndianOil’s Q2 FY 2026-27 operations?
IndianOil recorded lower activity across refinery, pipeline and total-sales measures in Q2 FY 2026-27 than in Q1 FY 2026-27. Refinery throughput decreased to 18.1 MMT from 19.2 MMT, pipeline throughput decreased to 25.3 MMT from 28.5 MMT, and total sales declined to 25.228 MMT from 26.211 MMT.
The presentation reports these as standalone operational results and does not state a reason for the sequential reductions. Pipeline throughput had the largest absolute movement, down 3.2 MMT, compared with a 1.1 MMT reduction in refinery throughput and a 0.983 MMT decline in total sales.
How did IndianOil refinery performance change in Q2?
IndianOil’s refinery capacity utilisation declined to 102.3% in Q2 FY 2026-27 from 109.4% in Q1 FY 2026-27, alongside the 1.1 MMT fall in throughput. Distillate yield declined to 78.9% from 80.2%, while fuel and loss increased to 8.5% from 8.0%.
Utilisation of high-sulphur crude increased to 54.6% from 48.9%, a 5.7-percentage-point change. The presentation lists the throughput, yield, fuel-and-loss and crude-use measures but does not link the change in high-sulphur crude use to the changes in refinery operations.
IndianOil listed three refinery expansions for expected completion in December 2026. As of 30 September 2026, Panipat’s expansion from 15 million metric tonnes per annum (MMTPA) to 25 MMTPA was 95.0% complete, Gujarat’s expansion from 13.7 MMTPA to 18 MMTPA was 90.1% complete, and Barauni’s expansion from 6 MMTPA to 9 MMTPA was 92.5% complete.
What happened to IndianOil pipeline activity in Q2?
IndianOil’s pipeline throughput fell 3.2 MMT sequentially to 25.3 MMT, while pipeline capacity utilisation decreased to 64.3% from 79.9%. The 15.6-percentage-point utilisation reduction exceeded the 7.1-percentage-point decline in refinery capacity utilisation.
The operating data does not identify individual pipeline routes or products behind the Q2 movement. IndianOil’s project update says the new Mundra-Panipat crude oil pipeline across Gujarat, Haryana and Rajasthan was under commissioning after mechanical completion in July 2026, with a gross approved cost of Rs 9,028 crore.
IndianOil incurred provisional pipeline capital expenditure of Rs 582 crore in H1 FY 2026-27, compared with Rs 6,083 crore in refineries and Rs 3,396 crore in marketing. Total provisional segment-wise capital expenditure was Rs 12,162 crore against the FY 2026-27 capital-expenditure target of Rs 32,700 crore.
Got a follow-up? Ask IRIS
Which IndianOil sales categories rose and fell in Q2?
IndianOil’s petroleum-products sales subtotal fell 1.114 MMT to 22.367 MMT, as inland petroleum sales declined by 1.402 MMT to 21.140 MMT. Petroleum exports increased by 0.288 MMT to 1.227 MMT, but did not offset the decline in inland sales.
High-speed diesel (HSD) was the largest named decline, falling 1.870 MMT to 8.996 MMT from 10.866 MMT. Motor spirit (MS) declined by 0.098 MMT to 4.424 MMT and aviation turbine fuel (ATF) decreased by 0.044 MMT to 1.168 MMT, while fuel oil and low-sulphur heavy stock rose by 0.122 MMT to 1.002 MMT.
Did IndianOil’s growing products offset the total-sales decline?
No. IndianOil’s other-products subtotal increased by 0.131 MMT to 2.861 MMT, while its petroleum-products subtotal fell by 1.114 MMT to 22.367 MMT. The difference between those movements resulted in the 0.983 MMT reduction in total sales.
LPG sales rose by 0.385 MMT to 3.470 MMT, the largest increase among named inland petroleum products. Lubricants and greases increased by 0.064 MMT to 0.261 MMT, and gas sales rose by 0.060 MMT to 1.933 MMT.
Petrochemical sales increased to 0.858 MMT from 0.768 MMT. Domestic petrochemical sales rose by 0.086 MMT to 0.834 MMT and exports increased by 0.004 MMT to 0.024 MMT; the presentation provides no revenue or margin figures for these product volumes.
Conclusion
IndianOil’s Q2 FY 2026-27 data shows sequential reductions in refinery throughput, pipeline throughput and total sales. Lower HSD, MS and ATF volumes accompanied a 1.114 MMT decrease in petroleum-products sales, while growth in LPG, gas, lubricants and petrochemicals increased other-product sales by 0.131 MMT without offsetting the total decline.
The next operating comparison will show how volumes develop as projects advance. IndianOil expects the Panipat, Gujarat and Barauni refinery expansions to be completed in December 2026, while the Mundra-Panipat crude oil pipeline remained under commissioning after mechanical completion in July 2026; the presentation gives no operating-volume targets for these assets.