










JSW Infrastructure revenue rose 18% while H1 PAT fell 10%
Key highlights
- JSW Infrastructure’s H1 FY27 revenue from operations rose 18% to Rs 2,926 crore.
- JSW Infrastructure’s H1 FY27 PAT declined 10% to Rs 686 crore.
- JSW Infrastructure’s logistics operating EBITDA rose 242% to Rs 153 crore in H1 FY27.
- JSW Infrastructure’s net worth rose to Rs 17,587 crore from Rs 9,836 crore.
powered by IRIS
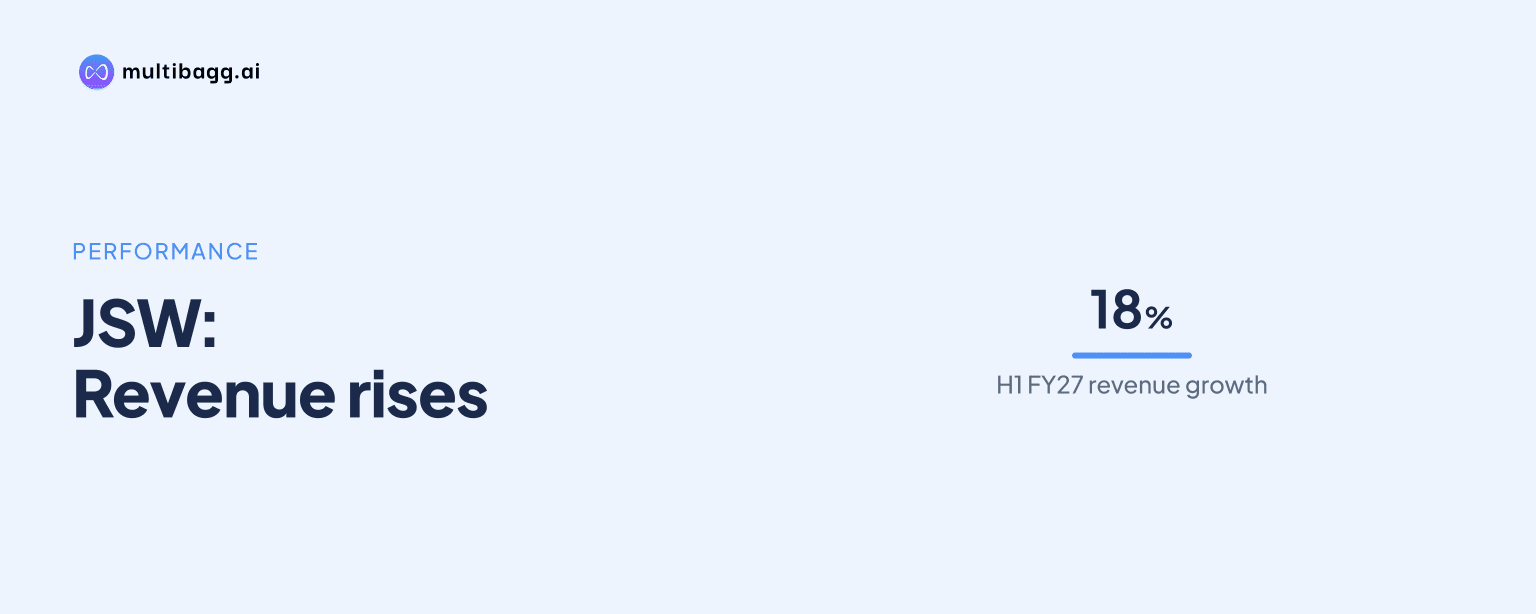
In H1 FY27, JSW Infrastructure increased revenue from operations 18% to Rs 2,926 crore, but profit after tax fell 10% to Rs 686 crore, while net worth rose to Rs 17,587 crore from Rs 9,836 crore a year earlier. Operating EBITDA increased 13%, although its margin declined to 46.1%.
Know JSW Infrastructure inside out
Results, valuation, peers and who's buying, in one view.
How did JSW Infrastructure perform financially in H1 FY27?
JSW Infrastructure delivered higher revenue and operating earnings in H1 FY27, but lower profit after tax. Revenue from operations increased by Rs 437 crore to Rs 2,926 crore from Rs 2,489 crore in H1 FY26, while total revenue rose 18% to Rs 3,171 crore from Rs 2,686 crore.
Operating earnings before interest, tax, depreciation and amortisation, or operating EBITDA, rose 13% to Rs 1,348 crore from Rs 1,191 crore. The operating EBITDA margin declined by 1.7 percentage points to 46.1% from 47.8%, as revenue grew faster than operating EBITDA. Reported EBITDA increased 15% to Rs 1,594 crore and its margin reduced to 50.3% from 51.7%.
Why did JSW Infrastructure’s H1 FY27 profit after tax decline?
JSW Infrastructure’s presentation does not disclose a specific reason for the H1 FY27 decline in profit after tax, or PAT. PAT was Rs 686 crore, compared with Rs 758 crore in H1 FY26, even though reported EBITDA increased by Rs 207 crore to Rs 1,594 crore.
The disclosed operating figures show slower earnings growth than revenue growth. Operating EBITDA rose 13% against an 18% increase in revenue from operations, and the operating margin moved to 46.1% from 47.8%. The ports business reported earnings before interest and tax, excluding other income, of Rs 906 crore in H1 FY27, up 3% from Rs 882 crore.
In Q2 FY27, ports revenue from operations rose 9% to Rs 1,202 crore, while operating EBITDA increased 2% to Rs 594 crore. The ports operating EBITDA margin declined to 49.4% from 53.1%, and its earnings before interest and tax reduced to Rs 448 crore from Rs 451 crore.
Which segments drove JSW Infrastructure’s H1 FY27 growth?
JSW Infrastructure’s logistics segment grew faster than its ports business in H1 FY27. Logistics revenue from operations rose 72% to Rs 517 crore from Rs 301 crore, while operating EBITDA increased 242% to Rs 153 crore from Rs 45 crore. Its operating EBITDA margin rose to 29.7% from 14.9%.
The logistics segment comprises JSW Port Logistics, Navkar Corp, Arakkonam GCT and Kudathini ICD. Ports revenue from operations increased 10% to Rs 2,409 crore, while ports operating EBITDA rose 4% to Rs 1,195 crore. The ports margin of 49.6% was below its 52.4% H1 FY26 level but above the logistics margin of 29.7%.
Navkar Corp reported H1 FY27 revenue from operations of Rs 414 crore, up 38% from Rs 301 crore, and PAT of Rs 24 crore, compared with Rs 7 crore. Domestic volume rose 26% to 844 thousand metric tonnes, while export-import volume increased 7% to 171 thousand twenty-foot equivalent units.
Got a follow-up? Ask IRIS
What do JSW Infrastructure’s operating metrics show?
JSW Infrastructure had cargo-handling capacity of 186 million tonnes per annum in H1 FY27, compared with 183 million tonnes per annum in FY26. Capacity utilisation was 60.0%, below 62.3% in FY26 and 63.9% in FY25; the company calculates this measure using available cargo-handling capacity.
Cargo handled was 60.5 million tonnes in H1 FY27, against 122 million tonnes in the full FY26. Third-party cargo represented 47% of H1 FY27 cargo and JSW Group cargo 53%, compared with 48% and 52%, respectively, in FY26. The third-party share was 25% in FY21, versus 75% for JSW Group cargo.
Across FY21 to FY26, revenue from operations increased from Rs 1,604 crore to Rs 5,361 crore, a 27% compound annual growth rate stated by the company. Operating EBITDA rose from Rs 816 crore to Rs 2,604 crore over the same period, while PAT increased from Rs 285 crore to Rs 1,644 crore; the company presents PAT growth at 42%, adjusted for FY25 and FY26.
How has JSW Infrastructure’s balance sheet changed?
JSW Infrastructure’s net debt-to-equity ratio declined to 0.27 times in FY26 from 1.17 times in FY21, while net debt to operating EBITDA reduced to 1.19 times from 4.42 times. Both ratios were nevertheless higher than their FY24 levels of 0.01 times and 0.03 times, respectively.
The company defines net debt as total debt less cash and cash equivalents, specified bank balances and current investments. For its leverage calculation, operating EBITDA is profit before exceptional items and tax, less other income, plus finance costs, depreciation and amortisation. Net worth, excluding non-controlling interest and capital reserve, rose 79% to Rs 17,587 crore in H1 FY27.
Return on capital employed was 12% on a trailing-12-month basis in H1 FY27, compared with 14% in FY26 and 15% in FY25. JSW Infrastructure calculates this ratio as profit before tax and finance costs divided by average capital employed, comprising total equity, total debt and deferred tax.
Conclusion
JSW Infrastructure’s H1 FY27 results show expanding revenue, led by 72% logistics revenue growth, alongside slower operating EBITDA growth and a 10% decline in PAT. Net worth increased sharply from H1 FY26, while FY26 leverage ratios remained well below FY21 levels despite rising from their FY24 lows.
The presentation does not identify the reason PAT fell despite higher EBITDA, making subsequent disclosures on this divergence relevant. Readers can also track whether capacity utilisation moves from 60.0%, whether ports margin changes from 49.6%, and whether the FY26 net debt-to-operating-EBITDA ratio of 1.19 times changes as capacity expands.