










JSW Infrastructure port margin fell as H1 volume rose 10%
Key highlights
- India port operations handled 60.3 million tonnes in H1 FY27, up 10% year on year.
- Port operating EBITDA margin declined to 49.6% in H1 FY27 from 52.4% in H1 FY26.
- Port revenue rose 10% to Rs 2,409 crore in H1 FY27, while operating EBITDA increased 4% to Rs 1,195 crore.
- Third-party port cargo declined 1% to 28.3 million tonnes in H1 FY27.
powered by IRIS
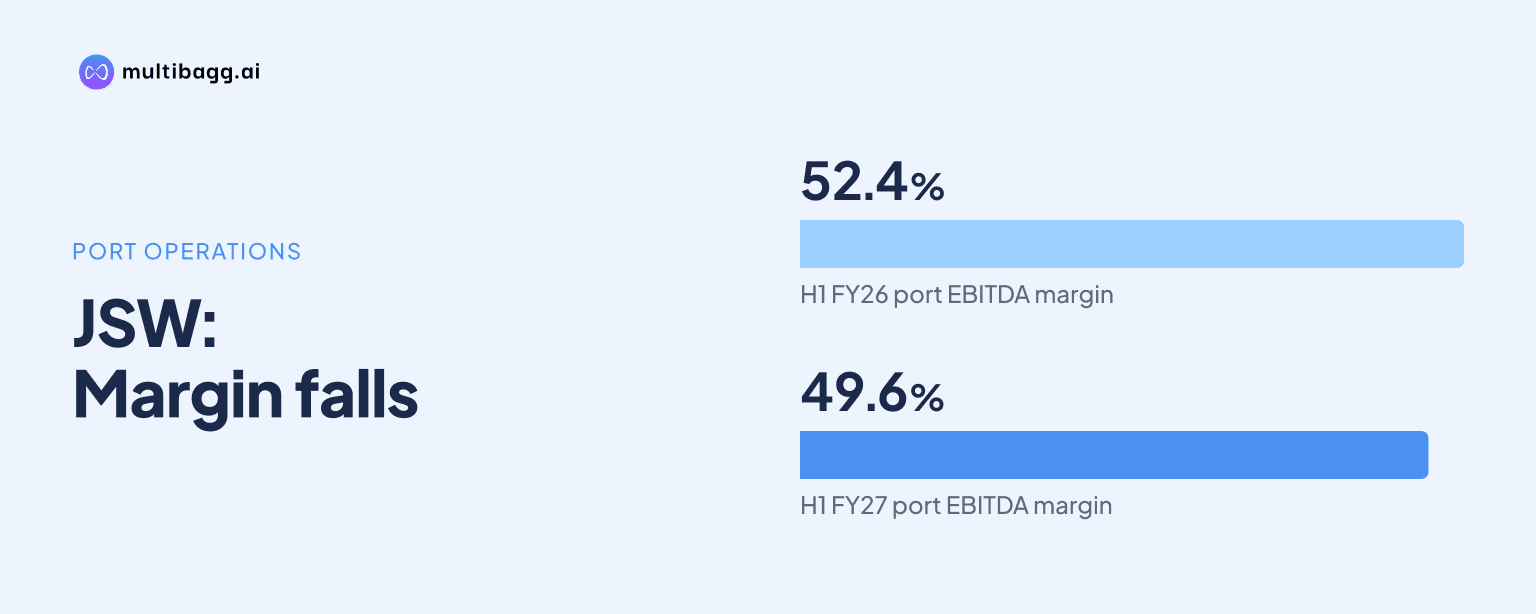
JSW Infrastructure’s port operating EBITDA margin fell to 49.6% in H1 FY27 even as India operations’ cargo volume rose 10% year on year to 60.3 million tonnes. Port revenue increased 10% to Rs 2,409 crore, but operating EBITDA increased 4% to Rs 1,195 crore, widening the gap between revenue and profit growth.
Know JSW Infrastructure inside out
Results, valuation, peers and who's buying, in one view.
Why did JSW Infrastructure’s port EBITDA margin fall in H1 FY27?
JSW Infrastructure’s presentation does not specify a cost or operational cause for the margin decline. It reports port revenue growth of 10% to Rs 2,409 crore in H1 FY27, while operating EBITDA, or earnings before interest, tax, depreciation and amortisation, rose 4% to Rs 1,195 crore. The resulting operating EBITDA margin was 49.6%, down from 52.4% in H1 FY26, a decline of 280 basis points.
The presentation does not provide a cost-line bridge for the 2.8-percentage-point margin movement. It does show that earnings before interest and tax, excluding other income, increased 3% to Rs 906 crore in H1 FY27 from Rs 882 crore a year earlier, again trailing the 10% increase in revenue. This establishes the reported financial pattern but does not assign the margin change to a specific expense, terminal, tariff or cargo type.
Which port operations drove JSW Infrastructure’s H1 volume growth?
JSW Infrastructure identified Paradip Coal, Dharamtar, Jaigarh, South West Port and Ennore Bulk Terminal as the operations with robust throughput growth in H1 FY27. Its India operations handled 60.3 million tonnes in the half year, compared with 55.0 million tonnes in H1 FY26, while total cargo handled reached 60.5 million tonnes versus 58.2 million tonnes.
Interim operations at Tuticorin Bulk Terminal also supported the H1 result, according to JSW Infrastructure. The presentation does not disclose individual terminal volumes, so it does not quantify how much each named site contributed to the 5.3-million-tonne rise in India operations. It does, however, identify a challenging operating environment at Fujairah Liquid Terminal as a partial offset to the throughput gains.
The quarterly pattern was more mixed than the half-year list suggests. In Q2 FY27, improved capacity utilisation at Paradip Coal, Ennore Bulk and Mangalore Coal terminals, alongside interim operations at Tuticorin Bulk Terminal and Kolkata Container Terminal, supported India operations’ 8% growth to 29.4 million tonnes. Lower volumes at Jaigarh Port and Paradip Iron Ore Terminal, plus the Fujairah operating environment, partly offset those gains during the quarter.
How did JSW Infrastructure’s cargo mix change in H1 FY27?
JSW Infrastructure’s mix shifted modestly toward JSW Group cargo in H1 FY27, with group cargo representing 53% of handled volume compared with 51% in H1 FY26. Third-party cargo represented 47%, down from 49%, while reported third-party throughput slipped 1% to 28.3 million tonnes from 28.4 million tonnes.
Group cargo volumes increased 8% year on year in H1 FY27, which JSW Infrastructure said underscored the resilience of its business model. The mix data also shows that the 10% growth in India operations was not accompanied by growth in third-party cargo on the reported half-year measure. The presentation does not provide revenue or margin by customer category, so no conclusion can be drawn from it on the relative profitability of group and third-party cargo.
The Q2 comparison showed a similar directional movement in mix, though third-party tonnage was slightly higher. JSW Group cargo accounted for 55% of volume in Q2 FY27, versus 54% a year earlier, while third-party cargo represented 45% versus 46%. Third-party cargo rose 1% to 13.3 million tonnes in Q2 from 13.2 million tonnes, compared with total India operations volume of 29.4 million tonnes.
Got a follow-up? Ask IRIS
How did the H1 port result compare with Q2 FY27?
JSW Infrastructure’s Q2 port margin was 49.4%, marginally below the 49.6% H1 margin and 3.7 percentage points below the 53.1% reported in Q2 FY26. Q2 revenue rose 9% to Rs 1,202 crore, but operating EBITDA rose 2% to Rs 594 crore. Earnings before interest and tax excluding other income declined 0.6% to Rs 448 crore from Rs 451 crore.
This quarterly result follows the H1 pattern of revenue growth exceeding operating EBITDA growth. In H1 FY27, Rs 220 crore of additional port revenue compared with H1 FY26 was accompanied by Rs 49 crore of additional operating EBITDA. In Q2 FY27, revenue increased by Rs 99 crore year on year, while operating EBITDA increased by Rs 9 crore. These comparisons describe the reported results and do not identify an underlying cost cause.
Cargo growth was also more moderate on a total basis in Q2 than across the half year. Total cargo handled rose 2% to 29.4 million tonnes in Q2 FY27 from 28.9 million tonnes, because India operations’ increase to 29.4 million tonnes was set against 1.6 million tonnes of overseas operations reported in Q2 FY26. For H1 FY27, total cargo rose 4% to 60.5 million tonnes while India operations rose 10%.
How does the port performance fit JSW Infrastructure’s wider H1 results?
JSW Infrastructure’s consolidated revenue from operations increased 18% to Rs 2,926 crore in H1 FY27, faster than the ports business’s 10% increase to Rs 2,409 crore. Consolidated operating EBITDA rose 13% to Rs 1,348 crore and its margin declined to 46.1% from 47.8%. The port business remained the larger reported revenue base, while the presentation shows growth outside ports contributing to the wider result.
The logistics segment reported revenue from operations of Rs 517 crore in H1 FY27, up 72% from Rs 301 crore, and operating EBITDA of Rs 153 crore, up 242% from Rs 45 crore. Its operating EBITDA margin increased to 29.7% from 14.9%. JSW Infrastructure defines this segment as JSW Port Logistics, Navkar Corp, Arakkonam GCT and Kudathini ICD, so these figures should not be treated as port-terminal performance.
Navkar Corp, one of the logistics businesses named in that definition, reported domestic volumes of 844 thousand metric tonnes in H1 FY27, up 26% from 669 thousand metric tonnes. Its export-import container volume rose 7% to 171 thousand twenty-foot equivalent units from 160 thousand. These logistics measures use different units from port cargo and are relevant to segment expansion, not a direct comparison with the 60.5 million tonnes handled by the port operations.
Conclusion
JSW Infrastructure delivered higher India port throughput and higher port revenue in H1 FY27, but operating EBITDA and earnings before interest and tax grew more slowly. The key reported contrast is 10% growth in India cargo volume and revenue against 4% operating EBITDA growth, which reduced the port margin from 52.4% to 49.6%.
The next disclosed milestones include mechanisation works at the 30-million-tonne-per-annum Jatadhar Port by March 2027 and construction completion of the 30-million-tonne-per-annum slurry pipeline by March 2027. JSW Infrastructure is also progressing its rail rake fleet from 78 toward 110 rakes by March 2027, while Keni Port commercial operations are expected in FY 2030.