










JTEKT India Limited H1 PAT falls 20% as costs outpace sales
Key highlights
- H1 FY 2026-27 sales rose 29% to Rs 1,552.7 crore, while PAT fell 20% to Rs 22.7 crore.
- Material cost increased to 74.2% of sales from 72.7% in YTD September 2025.
- Management estimated a Rs 10.2 crore impact from Haryana minimum wages increasing 35%.
- Finance cost rose 77% to Rs 10.8 crore in YTD September 2026.
powered by IRIS
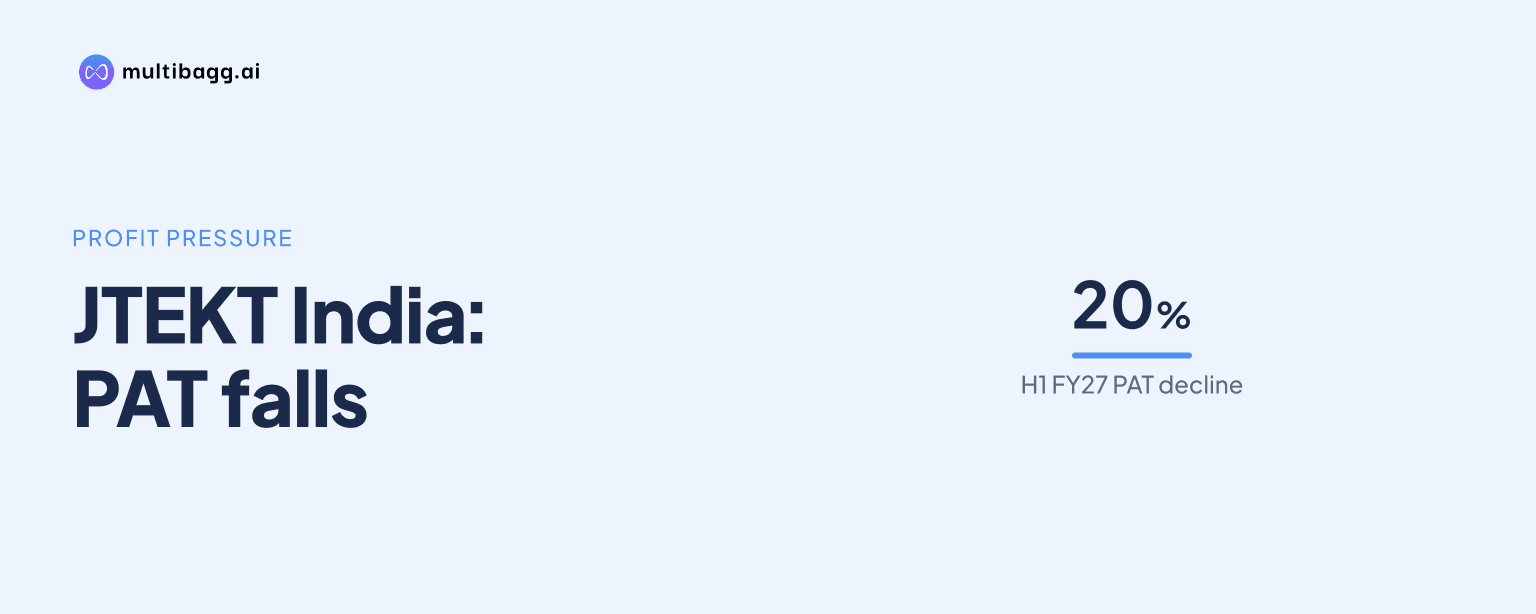
JTEKT India Limited reported profit after tax of Rs 22.7 crore in H1 FY 2026-27, down 20% from Rs 28.4 crore a year earlier, although sales rose 29% to Rs 1,552.7 crore. Higher material costs, depreciation, finance costs and lower other income reduced the conversion of revenue growth into profit.
Know JTEKT India inside out
Results, valuation, peers and who's buying, in one view.
Why did JTEKT India’s H1 profit fall despite sales growth?
JTEKT India’s H1 profit fell because sales growth did not offset cost increases and below-operating-profit charges in YTD September 2026. Sales rose from Rs 1,205.1 crore in YTD September 2025 to Rs 1,552.7 crore, while profit after tax, or PAT, declined by Rs 5.7 crore to Rs 22.7 crore. PAT margin narrowed to 1.5% from 2.4%.
Earnings before interest, tax, depreciation and amortisation, or EBITDA, increased 25% to Rs 94.9 crore, which was slower than the 29% sales increase. EBITDA margin declined to 6.1% from 6.3%, while operating profit rose 9% to Rs 35.3 crore after depreciation increased 36% to Rs 59.7 crore.
Profit before tax from operations fell 19% to Rs 31.1 crore as finance cost rose 77% to Rs 10.8 crore and other income declined 46% to Rs 6.7 crore. The combined effect meant that higher sales and absolute EBITDA did not result in a higher H1 net profit.
How did JTEKT India’s cost mix change in H1 FY 2026-27?
JTEKT India’s material-cost ratio increased by 1.5 percentage points to 74.2% of sales in H1 FY 2026-27 from 72.7% a year earlier. Material cost rose 32% to Rs 1,152 crore, exceeding the 29% increase in sales. Total expenditure rose to 93.9% of revenue from 93.7%.
Manufacturing cost increased 27% to Rs 95.8 crore and selling cost rose 26% to Rs 24.2 crore, both below the rate of revenue growth. Employee cost increased 19% to Rs 160.6 crore, but its share of sales declined to 10.3% from 11.2%. Administrative cost rose 8% to Rs 25.1 crore and fell to 1.6% of sales from 1.9%.
Management said savings in selling expenses and lower fixed administrative costs as a percentage of sales, linked to budgetary controls, partly offset the identified pressures. Even so, the 6.1% H1 EBITDA margin was below 6.3% in H1 FY 2025-26 and 7.5% for full-year FY 2025-26.
What specific costs reduced JTEKT India’s EBITDA margin?
Management identified aluminium, steel and wage-related costs as major factors reducing JTEKT India’s H1 FY 2026-27 EBITDA margin. It estimated a Rs 7.8 crore impact from aluminium prices, which it said rose more than 20% amid a short supply of imported scrap linked to the West Asia war crisis. Steel prices rose by around 4%, with a stated Rs 1.5 crore impact.
Management described the aluminium and steel effects as temporary, saying settlements with customers would occur according to the applicable schedule. Its analysis put the decline in EBITDA margin at 1.39 percentage points, from 7.50% in FY 2025-26 to 6.11% in H1 FY 2026-27. The presentation says these are major factors, rather than a complete profitability reconciliation.
Vendor claims settled or agreed for minimum wages and process-cost increases had a Rs 3.7 crore impact. Haryana minimum wages increased 35%, resulting in a stated Rs 10.2 crore employee-cost impact, while security and housekeeping wages added Rs 1 crore to administrative costs. Management said it had sought customer compensation for the regulatory wage increase, but that this had not yet been settled.
Management also cited net income from customers falling to Rs 5 crore in H1 FY 2026-27 from Rs 12.5 crore in H1 FY 2025-26. In contrast, US export value increased to Rs 37 crore from Rs 31.7 crore, with management estimating a Rs 1.8 crore margin increase and describing the situation as gradually improving.
Got a follow-up? Ask IRIS
Did JTEKT India’s second-quarter earnings improve?
JTEKT India’s Q2 FY 2026-27 earnings improved from Q1, although margins remained below the prior-year quarter. Q2 sales were Rs 834.7 crore, 16% above Rs 718 crore in Q1 FY 2026-27 and 31% above Rs 639.1 crore in Q2 FY 2025-26. EBITDA rose 49% sequentially to Rs 56.9 crore.
Q2 EBITDA margin was 6.8%, compared with 5.3% in Q1 FY 2026-27 but 7.2% in Q2 FY 2025-26. PAT increased to Rs 16.6 crore from Rs 6.1 crore in Q1, but was 8% below Rs 18 crore a year earlier. PAT margin was 2.0%, against 0.9% in Q1 and 2.8% in the prior-year quarter.
Depreciation in Q2 rose 36% year on year to Rs 31.4 crore, finance cost increased 196% to Rs 5.6 crore, and other income fell 24% to Rs 2.8 crore. As a result, operating profit grew 11% to Rs 25.5 crore while profit before tax from operations declined 8% to Rs 22.6 crore.
How are product mix and capacity investment affecting JTEKT India?
JTEKT India said its H1 revenue growth of 28.8% exceeded cited industry growth of 23%, supported by vehicle models that performed better and new models introduced during FY 2025-26. It supplied constant velocity joints, or CVJs, for four Maruti and Toyota models and said it was ready to begin supplies for another model during the current financial year.
Driveline represented 7.1% of H1 FY-27 sales, up from 4.6% in H1 FY-26, while steering and columns accounted for 92.9%, down from 95.4%. CVJ represented 6.0% of product revenue versus 3.6%, while column electric power steering, or CEPS, declined to 42.0% from 45.9%. Exports increased to 3.3% of sales from 2.6%.
Debt-equity increased to 0.35 at YTD September 2026 from 0.28 in FY-26. Management attributed this to capacity investments including MS Gear Line 6 and CVJ Line 3 at Dharuhera-2, MS Gear Line 4 at Chennai, CEPS Line 3 at Bawal-1, and a forging facility at Dharuhera-3. These capacities were not fully utilised, while fixed-assets turnover was 3.26 at YTD September 2026, unchanged from FY-26.
Conclusion
JTEKT India’s H1 results show that a Rs 347.6 crore increase in sales did not offset a 1.5-percentage-point rise in material costs as a share of revenue, wage-related pressures and higher financing and depreciation charges. EBITDA increased by Rs 18.7 crore, but PAT declined by Rs 5.7 crore and the PAT margin fell to 1.5%.
The next disclosed issues are customer settlements for aluminium and steel costs, and compensation discussions for wage-related costs that remain unsettled. Management also plans to start supplies for another CVJ model during the current financial year, while utilisation of recently added capacity remains unresolved at YTD September 2026.