










JYOTI revenue nearly tripled as FY26 PAT margin reached 16.1%
Key highlights
- JYOTI's FY26 revenue from operations was Rs 2,093.1 crore, compared with Rs 746 crore in FY22.
- JYOTI reported FY26 PAT of Rs 336 crore and a 16.1% PAT margin, compared with a Rs 48 crore FY22 loss.
- JYOTI's gross profit margin increased to 55.1% in FY26 from 43.8% in FY22.
- JYOTI's FY26 working-capital movement consumed Rs 309.1 crore, leaving net operating cash flow at Rs 54.4 crore.
powered by IRIS
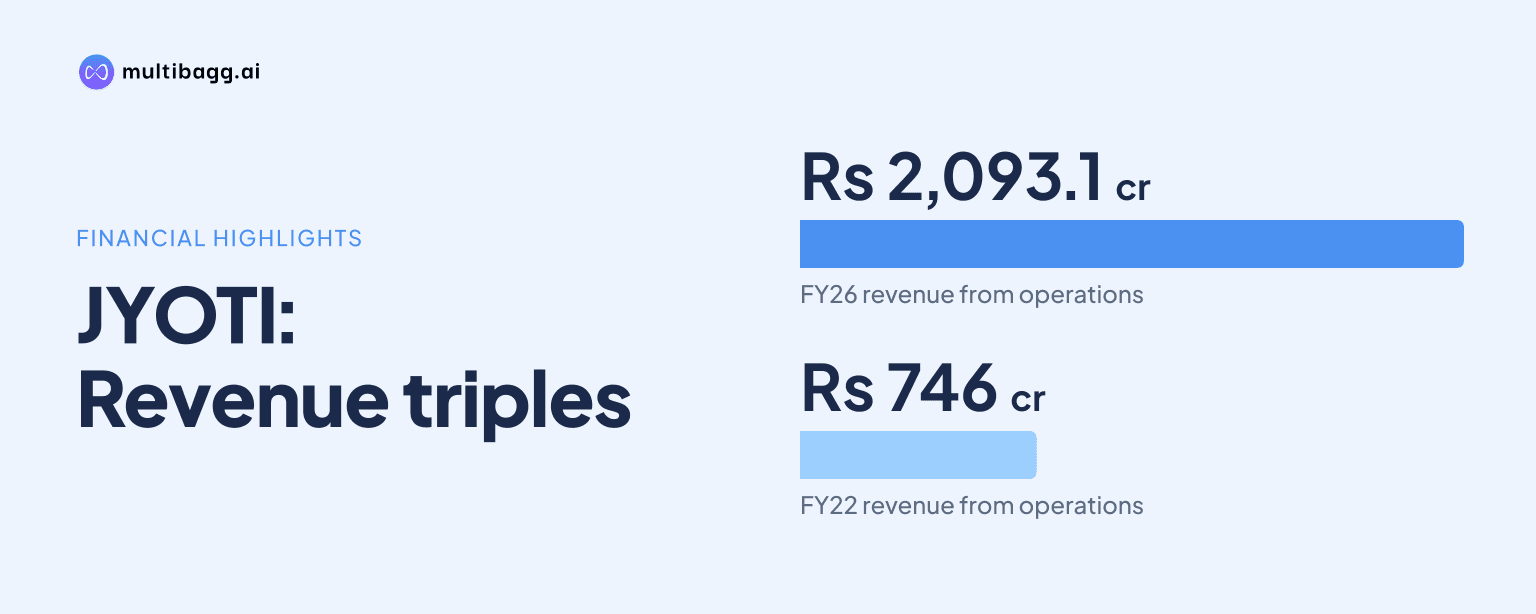
Jyoti CNC Automation Limited (JYOTI) increased revenue from operations from Rs 746 crore in FY22 to Rs 2,093.1 crore in FY26, while profit after tax (PAT) changed from a Rs 48 crore loss to Rs 336 crore profit and the PAT margin reached 16.1%. The growth coincided with higher gross margins, although working-capital movements continued to reduce operating cash generation.
Know Jyoti CNC Automation inside out
Results, valuation, peers and who's buying, in one view.
How much did JYOTI's revenue grow through FY26?
JYOTI's revenue from operations rose by Rs 1,347.1 crore between FY22 and FY26, reaching Rs 2,093.1 crore from Rs 746 crore. FY26 revenue was nearly 2.8 times the FY22 level, and the historical snapshot shows an increase in every year through the five-year period. Revenue increased by Rs 275.4 crore in FY26 from Rs 1,817.7 crore in FY25, after a Rs 479.2 crore increase in FY25 from FY24.
The detailed profit and loss statement shows gross profit rising from Rs 396.6 crore in FY23 to Rs 1,153.8 crore in FY26, while cost of goods sold rose from Rs 532.6 crore to Rs 939.3 crore. Gross profit therefore increased faster than revenue over those years, and the reported gross profit margin expanded by 12.4 percentage points to 55.1% in FY26 from 42.7% in FY23.
FY26 revenue growth was slower in absolute terms than the preceding year's increase, but it still added Rs 275.4 crore of sales. The FY26 gross profit margin of 55.1% was also above FY25's 52.2%, FY24's 49.7% and FY22's 43.8%, according to JYOTI's historical financial snapshot.
How did JYOTI move from a loss to profit?
JYOTI moved from a Rs 48 crore PAT loss in FY22 to Rs 15.1 crore of PAT in FY23, then reported Rs 150.9 crore in FY24, Rs 316 crore in FY25 and Rs 336 crore in FY26. Its PAT margin moved from negative 6.5% in FY22 to positive 1.6% in FY23 and 16.1% in FY26. FY26 PAT was Rs 20 crore higher than FY25, although the margin was 1.3 percentage points below FY25's 17.4%.
EBITDA rose to Rs 526.8 crore in FY26 from Rs 490.9 crore in FY25, but EBITDA margin declined to 25.2% from 27.0%. Employee cost increased by Rs 71.8 crore to Rs 330 crore and other expenses increased by Rs 97.3 crore to Rs 297.1 crore. Those two expense lines rose by a combined Rs 169.1 crore during FY26.
Finance cost was Rs 69.8 crore in FY26, compared with Rs 42.1 crore in FY25 and Rs 89.7 crore in FY24. Other income increased to Rs 60.5 crore from Rs 14.5 crore, while tax rose to Rs 131.2 crore from Rs 101.7 crore. Profit before tax reached Rs 467.2 crore in FY26, compared with Rs 417.7 crore in FY25, and the corresponding margin was 22.3% versus 23.0%.
Got a follow-up? Ask IRIS
How did JYOTI's margins, returns and leverage change?
JYOTI's gross profit margin increased in each year from FY22 to FY26, reaching 55.1% from 43.8%, while EBITDA margin peaked at 27.0% in FY25 before declining to 25.2% in FY26. Earnings before interest and tax (EBIT) reached Rs 537 crore in FY26, producing a 25.7% EBIT margin, compared with Rs 468.9 crore and a 25.8% margin in FY25. Depreciation increased to Rs 50.2 crore from Rs 36.5 crore over the same period.
Return on capital employed (ROCE) was 25.1% in FY26, compared with 21.5% in FY25 and 9.5% in FY23. Return on equity was 18.2% in FY26 versus 18.7% in FY25, while return on assets was 10.5% versus 11.3%. The debt-to-equity ratio was 0.4 times in FY26, after 0.3 times in FY25, 0.2 times in FY24 and 10.2 times in FY23.
Balance-sheet expansion accompanied the earnings growth. Total assets rose to Rs 3,615.3 crore at March 2026 from Rs 2,792 crore at March 2025, including inventories of Rs 1,166 crore and trade receivables of Rs 599.1 crore. Total equity increased to Rs 2,001.3 crore from Rs 1,686.2 crore, while current and non-current borrowings combined rose to Rs 849.7 crore from Rs 496.9 crore.
What does JYOTI's cash flow show about working capital?
JYOTI generated Rs 521.7 crore of operating profit before working-capital changes in March 2026, but working-capital changes consumed Rs 309.1 crore. Cash generated from operations was consequently Rs 212.7 crore. After Rs 125.4 crore of direct taxes paid and a Rs 32.9 crore exceptional item, net cash from operating activities was Rs 54.4 crore, compared with negative Rs 105.4 crore in March 2025.
Working-capital movements were negative in all four reported periods: Rs 77.2 crore in March 2023, Rs 152.5 crore in March 2024, Rs 522.5 crore in March 2025 and Rs 309.1 crore in March 2026. Between March 2025 and March 2026, inventories rose by Rs 265.5 crore and trade receivables rose by Rs 112.6 crore. These movements provide context for net operating cash of Rs 54.4 crore being below FY26 PAT of Rs 336 crore.
JYOTI reported investing cash outflow of Rs 302.1 crore in March 2026, following Rs 329 crore in March 2025, while financing activities generated Rs 287.2 crore and Rs 145.4 crore respectively. Cash and cash equivalents at the end of March 2026 were Rs 52.9 crore. The cash-flow statement reports Rs 8.6 crore at the end of March 2024, while the March 2024 balance sheet reports Rs 302.3 crore; the presentation does not provide a reconciliation.
Conclusion
JYOTI's FY22-to-FY26 record shows a substantial increase in sales and earnings, with revenue rising from Rs 746 crore to Rs 2,093.1 crore, EBITDA rising from Rs 73 crore to Rs 526.8 crore and PAT changing from a Rs 48 crore loss to Rs 336 crore profit. Gross margin reached 55.1%, while the 16.1% FY26 PAT margin was below FY25's 17.4% despite the increase in absolute profit.
The disclosed operational development to watch is JYOTI's capacity plan: it states that current manufacturing capacity is 6,000 machines annually and that additional capacity for 10,000 machines is being put to use, with foundry operations to commence in coming days. The reported Rs 309.1 crore FY26 working-capital outflow, Rs 302.1 crore investing outflow and the unreconciled March 2024 cash figures remain matters identified in the presentation's financial disclosures.