










Kaka Industries FY26 investing outflow reached Rs 34.5225 crore
Key highlights
- Kaka Industries reported Rs 34.5225 crore of net investing cash outflow in FY26, versus Rs 24.6850 crore in FY25.
- Kaka Industries’ combined borrowings rose to Rs 103.6541 crore in FY26 from Rs 72.0024 crore in FY25.
- Kaka Industries’ combined PPE and CWIP balance increased to Rs 104.3453 crore in FY26 from Rs 76.7291 crore in FY25.
- Kaka Industries generated Rs 15.8734 crore of operating cash flow in FY26, compared with Rs 3.8619 crore in FY25.
powered by IRIS
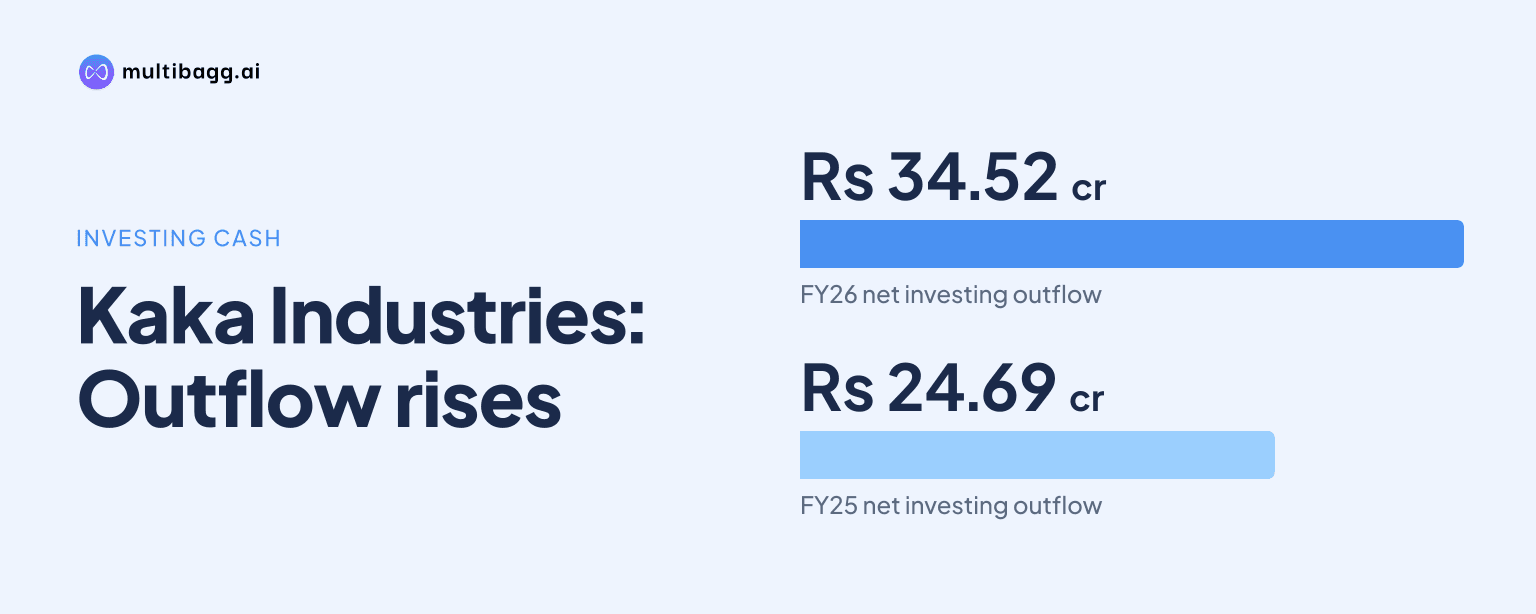
Kaka Industries Limited reported Rs 34.5225 crore of net cash used in investing activities in FY26 as property, plant and equipment and capital work-in-progress rose to a combined Rs 104.3453 crore. Kaka Industries’ combined current and non-current borrowings increased Rs 31.6517 crore year on year to Rs 103.6541 crore.
Know Kaka Industries inside out
Results, valuation, peers and who's buying, in one view.
How did Kaka Industries fund FY26 expansion?
Kaka Industries generated Rs 15.8734 crore from operating activities and reported Rs 25.2802 crore of financing cash inflow in FY26, against Rs 34.5225 crore used in investing activities. The three cash-flow categories together produced a Rs 6.6311 crore increase in cash and cash equivalents during FY26.
The investing outflow increased from Rs 24.6850 crore in FY25 to Rs 34.5225 crore in FY26, while financing inflow rose from Rs 21.2233 crore to Rs 25.2802 crore. The cash-flow statement does not provide a transaction-level split of investing expenditure or financing receipts, so it does not identify the funding source for individual asset additions.
Cash and cash equivalents closed FY26 at Rs 8.7687 crore in the cash-flow statement, compared with Rs 2.1370 crore at the start of the year. The FY26 balance sheet reports Rs 8.7688 crore of cash and cash equivalents, creating a Rs 1,000 difference from the cash-flow statement’s closing balance.
What changed in Kaka Industries’ asset base during FY26?
Kaka Industries increased property, plant and equipment, or PPE, to Rs 78.2693 crore in FY26 from Rs 69.8742 crore in FY25. Capital work-in-progress, or CWIP, rose to Rs 26.0760 crore from Rs 6.8549 crore, taking the combined PPE and CWIP balance to Rs 104.3453 crore from Rs 76.7291 crore.
CWIP accounted for Rs 19.2211 crore of the Rs 27.6162 crore increase in combined PPE and CWIP, compared with a Rs 8.3951 crore rise in PPE. The FY26 balance sheet also recorded Rs 3.75 lakh of intangible assets under development, a category absent in FY25 and FY24.
Total non-current assets increased to Rs 115.0418 crore from Rs 84.9000 crore, while current assets rose to Rs 93.4608 crore from Rs 71.9902 crore. Inventories increased Rs 7.6320 crore to Rs 47.4625 crore and trade receivables rose Rs 7.1080 crore to Rs 34.9822 crore, contributing to total assets of Rs 208.5026 crore in FY26.
How much did Kaka Industries borrow in FY26?
Kaka Industries reported Rs 103.6541 crore of total borrowings at the end of FY26, consisting of Rs 46.7565 crore of non-current borrowings and Rs 56.8976 crore of current borrowings. The total was Rs 31.6517 crore higher than the Rs 72.0024 crore reported at the end of FY25.
Non-current borrowings increased Rs 18.9822 crore from FY25, while current borrowings increased Rs 12.6695 crore. The presentation does not disclose lender names, interest rates, repayment schedules or the debt instruments within either borrowing classification.
Shareholders’ equity rose to Rs 83.1178 crore in FY26 from Rs 64.3438 crore in FY25, as reserves and surplus increased to Rs 69.4578 crore from Rs 50.6838 crore. Share capital remained Rs 13.6600 crore, while total non-current liabilities increased to Rs 50.4607 crore from Rs 30.4538 crore.
Got a follow-up? Ask IRIS
What did Kaka Industries’ FY26 cash flow show?
Kaka Industries’ operating cash flow rose to Rs 15.8734 crore in FY26 from Rs 3.8619 crore in FY25, while net investing cash outflow increased Rs 9.8375 crore to Rs 34.5225 crore. Financing cash inflow was Rs 25.2802 crore, compared with Rs 21.2233 crore in FY25.
FY26 was the third consecutive year of negative net investing cash flow in the presentation. Investing outflow was Rs 38.7490 crore in FY24, declined to Rs 24.6850 crore in FY25 and then increased to Rs 34.5225 crore in FY26, while financing cash flow was positive in all three years.
The operating cash-flow increase occurred while inventory and receivables also grew. Inventories rose to Rs 47.4625 crore from Rs 39.8305 crore and trade receivables rose to Rs 34.9822 crore from Rs 27.8742 crore, but the presentation provides no reconciliation identifying the working-capital drivers of operating cash flow.
Did Kaka Industries’ operating performance rise during the build-out?
Kaka Industries reported FY26 revenue from operations of Rs 263.2330 crore, up 33.1% from FY25, and earnings before interest, tax, depreciation and amortisation, or EBITDA, of Rs 35.9939 crore, up 36.6%. EBITDA margin increased to 13.7% from 13.3%, while profit after tax rose 46.0% to Rs 18.7740 crore.
Finance costs increased to Rs 6.3733 crore in FY26 from Rs 5.2140 crore in FY25, alongside the higher borrowing balance. Depreciation and amortisation rose to Rs 4.7221 crore from Rs 3.6385 crore, while net profit margin was 7.1%, compared with 6.5% in FY25 and 7.6% in FY24.
In H1 FY27, Kaka Industries reported revenue from operations of Rs 157.4696 crore, EBITDA of Rs 23.5760 crore and profit after tax of Rs 11.7610 crore. Finance costs were Rs 4.4468 crore in H1 FY27 versus Rs 2.8974 crore in H1 FY26; the presentation does not provide an FY27 borrowing balance or full-year cash-flow forecast.
Conclusion
Kaka Industries’ FY26 accounts show that increased investing activity coincided with a larger fixed-asset and CWIP base and higher borrowing balances. Net investing cash used was Rs 34.5225 crore, combined PPE and CWIP increased Rs 27.6162 crore, and total borrowings rose Rs 31.6517 crore, while operating cash flow increased to Rs 15.8734 crore.
The next disclosed item to watch is the conversion of Rs 26.0760 crore of CWIP into operating assets and the cash effect of the 7.5 megawatt captive solar plant. Management says the solar plant is expected to save Rs 35 lakh to Rs 40 lakh each month in electricity costs, although the presentation provides no commissioning date or project-level spending breakdown.