










KAKA PVC PROFILE H1 FY27 EBITDA rises 39% as margin expands
Key highlights
- KAKA’s H1 FY27 revenue from operations increased 26.08% to Rs 157.47 crore.
- KAKA’s H1 FY27 EBITDA rose 39.30% to Rs 23.58 crore.
- KAKA’s EBITDA margin expanded 140 basis points to 14.93% in H1 FY27.
- KAKA’s H1 FY27 PAT increased 32.85% to Rs 11.76 crore and diluted EPS reached Rs 8.61.
powered by IRIS
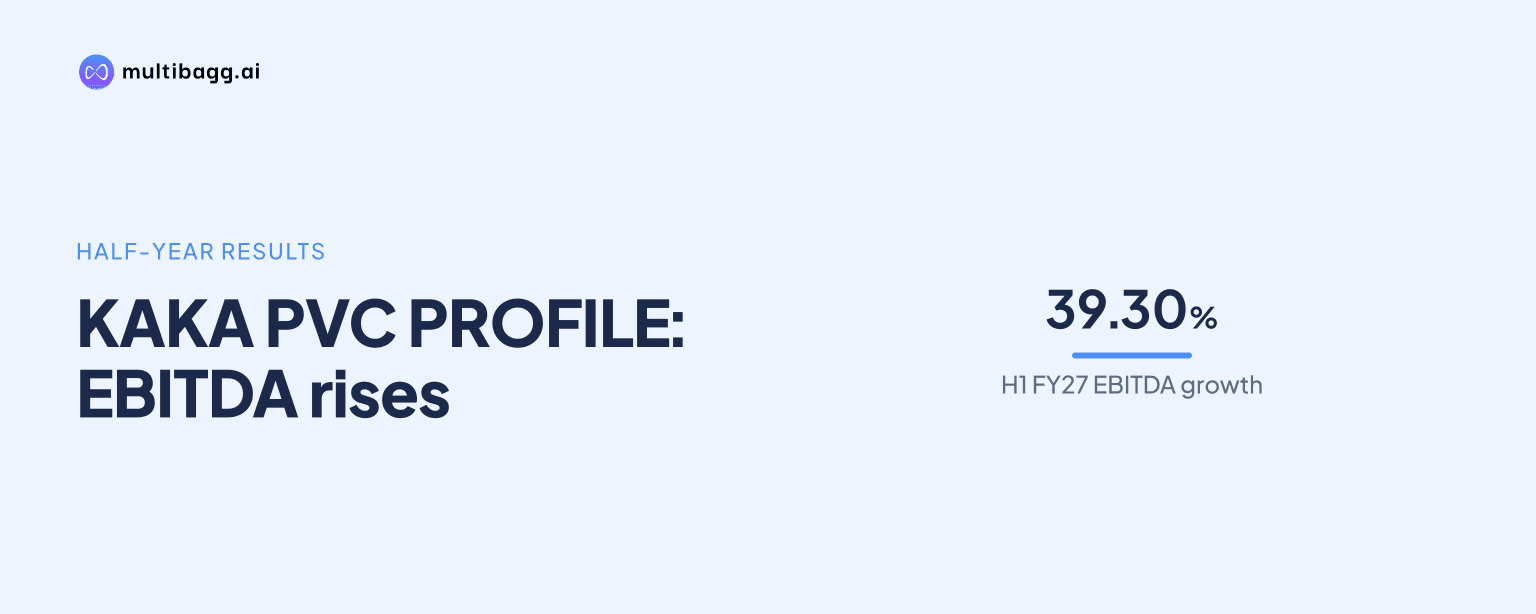
KAKA PVC PROFILE increased H1 FY27 EBITDA by 39.30% year on year to Rs 23.58 crore, exceeding 26.08% growth in revenue from operations and lifting its EBITDA margin to 14.93% from 13.53%. Net profit rose 32.85% to Rs 11.76 crore, while diluted earnings per share reached Rs 8.61.
Know Kaka Industries inside out
Results, valuation, peers and who's buying, in one view.
How did KAKA perform in H1 FY27?
KAKA reported revenue from operations of Rs 157.47 crore in H1 FY27, up from Rs 124.89 crore in H1 FY26, while EBITDA rose from Rs 16.92 crore to Rs 23.58 crore. The Rs 6.65 crore increase in EBITDA was larger than the prior-year operating-profit base, resulting in EBITDA growth of 39.30%, compared with revenue growth of 26.08%.
Total revenue, which includes other income, increased 26.25% to Rs 157.90 crore from Rs 125.07 crore. Other income was Rs 42.93 lakh in H1 FY27, compared with Rs 17.33 lakh in H1 FY26. KAKA reported net profit after tax, or PAT, of Rs 11.76 crore, against Rs 8.85 crore a year earlier.
KAKA’s EBITDA margin rose by 140 basis points to 14.93% in H1 FY27 from 13.53% in H1 FY26. A basis point is one-hundredth of a percentage point. Net profit margin increased by 37 basis points to 7.45% from 7.08%, a smaller expansion than at the EBITDA level.
What changed in KAKA’s H1 FY27 cost base?
KAKA’s total expenses increased to Rs 134.32 crore in H1 FY27 from Rs 108.14 crore in H1 FY26, while total revenue rose by Rs 32.83 crore to Rs 157.90 crore. The difference between total revenue and total expenses was Rs 23.58 crore, matching reported EBITDA, compared with Rs 16.92 crore in the prior-year half.
Cost of materials consumed remained the largest expense line, increasing to Rs 99.86 crore from Rs 81.65 crore. Purchases of stock-in-trade rose to Rs 14.69 crore from Rs 6.01 crore, while employee benefit expense increased to Rs 7.67 crore from Rs 5.63 crore. Other expenses were Rs 21.27 crore, compared with Rs 18.39 crore a year earlier.
Changes in inventories were negative Rs 9.17 crore in H1 FY27, compared with negative Rs 3.54 crore in H1 FY26. The presentation reports the margin increase alongside these cost movements but does not assign the 140-basis-point improvement to any individual expense category, facility or product group.
KAKA disclosed more than 2,000 stock-keeping units, or SKUs, across polyvinyl chloride, wood-plastic composite and unplasticised polyvinyl chloride product segments. Its investment rationale also cites an integrated manufacturing facility at Lasundra and four depots supporting distribution across more than 20 states and union territories, but gives no H1 FY27 segment-wise revenue or cost split.
Got a follow-up? Ask IRIS
How did finance costs and tax affect KAKA’s profit?
KAKA’s earnings before interest and tax, or EBIT, rose 39.75% to Rs 20.50 crore in H1 FY27 from Rs 14.67 crore in H1 FY26. Depreciation and amortisation increased to Rs 3.08 crore from Rs 2.26 crore, reducing EBITDA of Rs 23.58 crore to EBIT of Rs 20.50 crore.
Finance costs rose to Rs 4.45 crore from Rs 2.90 crore, while profit before tax increased 36.37% to Rs 16.05 crore from Rs 11.77 crore. The growth rate in profit before tax was below the 39.30% EBITDA increase, following the higher depreciation, amortisation and finance-cost charges shown in the income statement.
Current tax was Rs 2.57 crore in H1 FY27, compared with Rs 2.34 crore in H1 FY26. Prior-year tax was Rs 1.65 crore, against Rs 59.49 lakh in the earlier period, while deferred tax was Rs 7.39 lakh after deferred tax income of Rs 1.68 lakh in H1 FY26.
KAKA’s diluted earnings per share rose 32.87% to Rs 8.61 from Rs 6.48. PAT grew more slowly than EBITDA, at 32.85% against 39.30%, and the reported net profit margin expansion of 37 basis points was also below the 140-basis-point EBITDA-margin increase.
How does H1 FY27 compare with KAKA’s full-year trend?
KAKA’s FY26 revenue from operations was Rs 263.23 crore, up from Rs 197.78 crore in FY25 and Rs 170.22 crore in FY24. The presentation reports a 24.36% compound annual growth rate, or CAGR, for revenue across FY24 to FY26. H1 FY27 revenue of Rs 157.47 crore should be read as a six-month result rather than a full-year comparison.
FY26 EBITDA was Rs 35.99 crore, compared with Rs 26.36 crore in FY25 and Rs 21.43 crore in FY24. KAKA reported a 29.61% EBITDA CAGR across those three financial years. Its full-year EBITDA margin rose from 12.6% in FY24 to 13.3% in FY25 and 13.7% in FY26.
The H1 FY27 EBITDA margin of 14.93% was 123 basis points above FY26’s full-year 13.7% margin. H1 FY27 PAT of Rs 11.76 crore was below the FY26 full-year PAT of Rs 18.77 crore because H1 FY27 covers only the first half, while FY26 covers a full financial year.
At FY26-end, KAKA reported cash and cash equivalents of Rs 8.77 crore, up from Rs 2.14 crore at FY25-end. Current borrowings were Rs 56.90 crore and non-current borrowings were Rs 46.76 crore at FY26-end, while net cash flow from operating activities increased to Rs 15.87 crore from Rs 3.86 crore in FY25.
Conclusion
KAKA’s H1 FY27 result showed operating profit growth ahead of sales growth, with revenue from operations up 26.08%, EBITDA up 39.30% and EBITDA margin rising 140 basis points to 14.93%. PAT increased 32.85% to Rs 11.76 crore, although higher depreciation, finance costs and tax charges meant net-profit growth did not match EBITDA growth.
The next disclosed operational item to watch is KAKA’s 7.5-megawatt captive solar plant, which management expects to save Rs 35 lakh to Rs 40 lakh monthly in electricity costs. The presentation also identifies the Lasundra integrated facility and the portfolio of more than 2,000 SKUs as parts of its manufacturing and product plan.