










Kaka Industries Limited reports 64% H1 FY27 utilisation
Key highlights
- Kaka Industries reported 13,028 MT of production against 20,401 MT of capacity available in H1 FY27.
- Kaka Industries reported H1 FY27 utilisation of 64%, with a calculated 7,373 MT difference between capacity available and production.
- Kaka Industries reports three manufacturing units, four distribution depots and reach across 20+ states and Union Territories.
- PVC Profile contributed 53% of revenue, WPC Solid Profile 26% and uPVC Profile 5%.
powered by IRIS
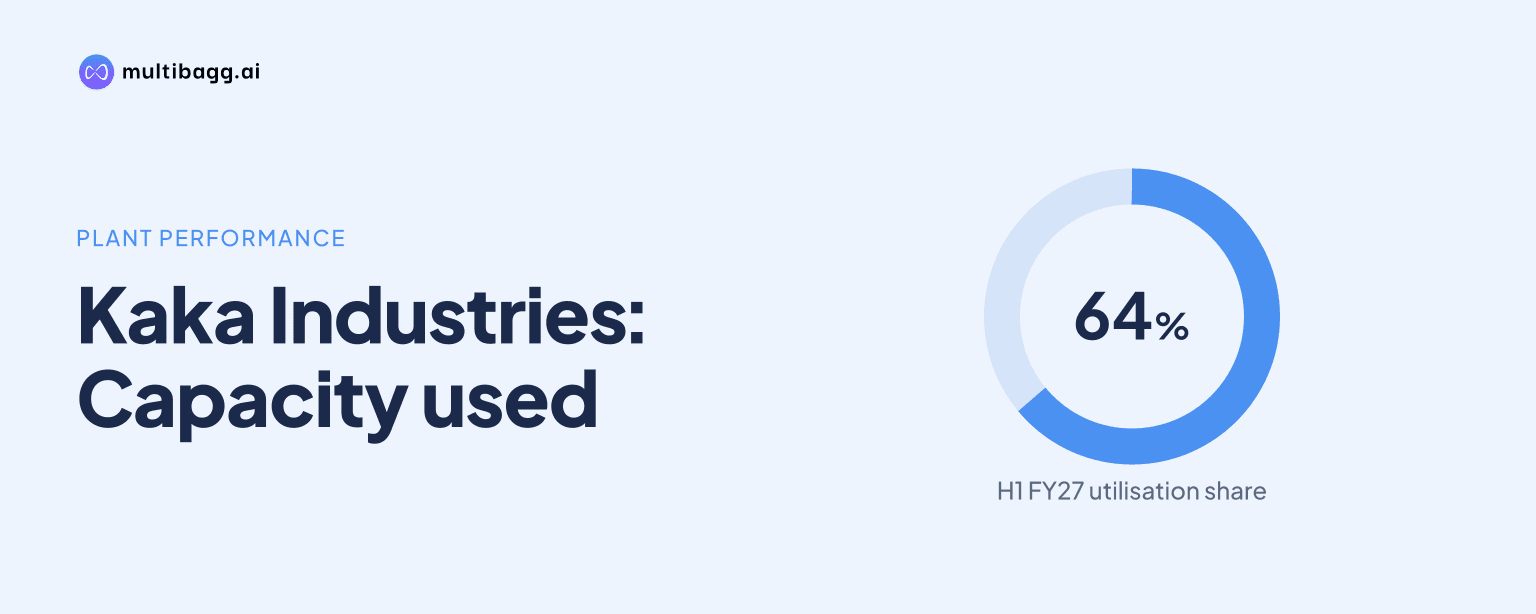
Kaka Industries Limited reported 64% utilisation in H1 FY27, producing 13,028 metric tonnes (MT) against 20,401 MT of capacity available for the period. The disclosed difference of 7,373 MT indicates unutilised capacity within the H1 FY27 measure, alongside a network of three manufacturing units, four distribution depots and presence across 20+ states and Union Territories.
Know Kaka Industries inside out
Results, valuation, peers and who's buying, in one view.
How much capacity did Kaka Industries use in H1 FY27?
Kaka Industries used 64% of the 20,401 MT capacity available in H1 FY27, with production of 13,028 MT. The presentation provides these figures at the aggregate manufacturing-footprint level and does not split production between facilities, products or customer segments.
The difference between H1 FY27 available capacity and production was 7,373 MT, calculated as 20,401 MT less 13,028 MT. This calculation is consistent with the reported 64% utilisation after rounding, but Kaka Industries does not separately label the difference as unused capacity.
Kaka Industries did not provide a prior-period production or utilisation figure in the presentation. As a result, the H1 FY27 rate of 64% cannot be compared with an earlier half year or financial year from the supplied material.
What does the H1 FY27 capacity gap show?
The H1 FY27 capacity gap shows that Kaka Industries produced 13,028 MT against 20,401 MT available, leaving a calculated difference of 7,373 MT. The figures indicate scope for additional output within the stated half-year capacity measure, although the presentation gives no demand forecast, sales target or utilisation objective.
Kaka Industries makes PVC, wood-plastic composite (WPC) and unplasticised polyvinyl chloride (uPVC)-based profiles, sheets and building solutions. Its stated applications cover residential housing, commercial and institutional infrastructure, furniture and modular interiors, doors and windows, and renovation products, but the presentation does not allocate the 13,028 MT of H1 FY27 production among those uses.
The company reports more than 2,000 stock-keeping units and more than 450 customers. Those figures show the breadth of its product and customer base, but they do not establish utilisation by production line, product category or manufacturing location.
Where are Kaka Industries' manufacturing operations located?
Kaka Industries reports three manufacturing units, while its integrated manufacturing-network slide names facilities at Lasundra and Zak GIDC. The presentation does not identify the third manufacturing unit on that slide or provide production and capacity data for individual locations.
The company reports total segment capacity of 40,499 metric tonnes per annum (MTPA) for its manufacturing network. This annual figure is not directly comparable with the 20,401 MT capacity-available measure for H1 FY27 because Kaka Industries provides no reconciliation between the two definitions.
Kaka Industries has four distribution depots and covers 20+ states and Union Territories. Its timeline records the establishment of a Hyderabad depot in 2020, expansion through Surat and Ghaziabad depots in 2021-22, and expanded Ahmedabad depot presence in 2024-25.
Got a follow-up? Ask IRIS
Which Kaka Industries products contribute most revenue?
PVC Profile is Kaka Industries' largest disclosed revenue category at 53%, followed by WPC Solid Profile at 26% and uPVC Profile at 5%. Together, the three specified categories account for 84% of revenue, while the presentation does not identify the products comprising the remaining 16%.
PVC Profile applications include wall panels, ceiling panels, doors, partitions, sections, decorative products and kitchen furniture. WPC Solid Profile is used in doors, kitchen cabinets, wardrobes, door frames, ply, wall panels and furniture, linking the two largest reported revenue categories to construction and interior applications.
uPVC Profile, which accounts for 5% of revenue, is used for doors, windows and wall panels. Kaka Industries also lists uPVC roofing sheets, wall cladding, charcoal panels, WPC louvers and decking, but revenue shares do not establish production volumes or capacity utilisation for any product line.
How has Kaka Industries expanded its manufacturing base?
Kaka Industries' manufacturing history runs from an initial Ahmedabad unit with about 350 MTPA in 2008 to 40,499 MTPA of reported total segment capacity. Intermediate milestones include a Gandhinagar facility with about 1,400 MTPA in 2009 and capacity scaled to about 3,000 MTPA during 2012-14.
The company entered the uPVC window segment during 2012-14 and added WPC solid sheets and foam boards during 2015-19. Its Lasundra expansion in 2023-24 added new product categories, and Kaka Industries says the Lasundra facility was fully operational in 2024-25.
The historical capacity figures are expressed in MTPA, while the operating disclosure reports 20,401 MT of capacity available and 13,028 MT of production in H1 FY27. Kaka Industries does not provide a conversion from annual total segment capacity to the H1 FY27 available-capacity figure, nor does it disclose a further capacity-expansion schedule.
Conclusion
Kaka Industries reported 64% utilisation in H1 FY27 from production of 13,028 MT against 20,401 MT of available capacity. The calculated 7,373 MT difference sits within a manufacturing network of three units, four depots and 40,499 MTPA of total segment capacity, serving PVC, WPC and uPVC product categories.
The key unresolved point is how the 40,499 MTPA annual segment-capacity figure relates to the 20,401 MT available in H1 FY27, because the presentation does not reconcile the measures. A later disclosure of facility-level output, product-level utilisation or a new production target would clarify whether PVC Profile's 53% revenue share and WPC Solid Profile's 26% share align with available manufacturing capacity.