










Kheria Autocomp Limited FY26 Profit More Than Doubled in Two Years
Key highlights
- Kheria Autocomp’s net profit rose to Rs 11.4233 crore in FY26 from Rs 3.3065 crore in FY24.
- Revenue from operations increased to Rs 120.0147 crore in FY26 from Rs 62.3193 crore in FY24.
- EBITDA margin expanded to 19.1% in FY26 from 15.7% in FY24.
- Long-term borrowings increased to Rs 26.6550 crore in FY26 from Rs 15.9527 crore in FY24, while the current ratio was 0.82 times.
powered by IRIS
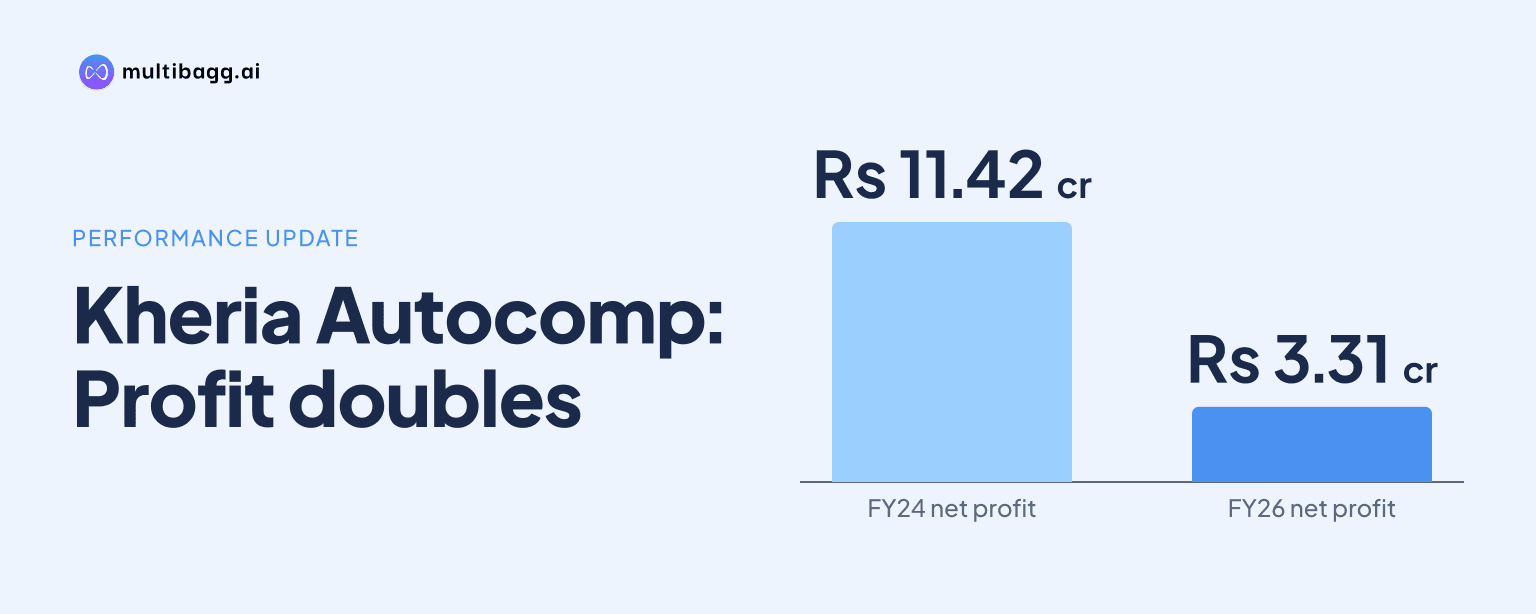
Kheria Autocomp Limited more than tripled net profit from Rs 3.3065 crore in FY24 to Rs 11.4233 crore in FY26, while revenue from operations rose from Rs 62.3193 crore to Rs 120.0147 crore. Earnings before interest, tax, depreciation and amortisation, or EBITDA, margin increased to 19.1% from 15.7% over the period.
Know Kheria Autocomp inside out
Results, valuation, peers and who's buying, in one view.
How did Kheria Autocomp profit change from FY24 to FY26?
Kheria Autocomp’s net profit increased by Rs 8.1168 crore from FY24 to FY26, reaching Rs 11.4233 crore from Rs 3.3065 crore. The presentation reports an 85.87% compound annual growth rate, or CAGR, for net profit during the FY24-FY26 period, compared with a 38.77% CAGR for revenue from operations.
Profit growth occurred in both years of the comparison. Net profit rose to Rs 8.2449 crore in FY25 and then increased by Rs 3.1784 crore in FY26. Diluted earnings per share, or EPS, rose from Rs 2.94 in FY24 to Rs 7.33 in FY25 and Rs 10.15 in FY26.
Kheria Autocomp’s profit before tax reached Rs 15.6264 crore in FY26, up from Rs 5.1256 crore in FY24. Total tax expense was Rs 4.2031 crore in FY26 versus Rs 1.8191 crore in FY24, resulting in FY26 profit after tax, or PAT, of Rs 11.4233 crore.
What changed in Kheria Autocomp’s operating costs and earnings?
Kheria Autocomp’s EBITDA rose faster than revenue, increasing from Rs 9.7608 crore in FY24 to Rs 22.8965 crore in FY26, while revenue from operations increased from Rs 62.3193 crore to Rs 120.0147 crore. This difference is reflected in the reported 53.16% EBITDA CAGR, which exceeded the 38.77% revenue CAGR over FY24-FY26.
Cost of materials consumed increased to Rs 81.2479 crore in FY26 from Rs 39.7227 crore in FY24. Employee benefit expense rose to Rs 10.4154 crore from Rs 6.3154 crore, while other expenses increased to Rs 9.0449 crore from Rs 6.5244 crore.
Changes in inventories of finished goods and work in progress reduced reported expenses by Rs 3.5900 crore in FY26, compared with reductions of Rs 1.0265 crore in FY25 and Rs 0.0040 crore in FY24. Total expenses rose to Rs 97.1182 crore in FY26 from Rs 52.5585 crore in FY24, while total revenue increased to Rs 120.2960 crore from Rs 62.3993 crore.
Depreciation and amortisation increased to Rs 4.3879 crore in FY26 from Rs 2.8929 crore in FY24, and finance costs rose to Rs 3.1634 crore from Rs 1.8222 crore. Even after these costs, earnings before interest and tax reached Rs 18.5086 crore in FY26, compared with Rs 6.8679 crore in FY24.
Got a follow-up? Ask IRIS
How did Kheria Autocomp’s margins change?
Kheria Autocomp’s EBITDA margin expanded by 3.4 percentage points to 19.1% in FY26 from 15.7% in FY24. The margin rose to 17.6% in FY25 before increasing by a further 1.5 percentage points in FY26.
Net profit margin increased by 4.2 percentage points to 9.5% in FY26 from 5.3% in FY24. It reached 9.0% in FY25, when PAT rose to Rs 8.2449 crore, before moving to Rs 11.4233 crore in FY26.
The first-half FY27 figures show a different margin pattern from the annual FY24-FY26 trend. EBITDA margin was 17.60% in H1 FY27, one basis point above 17.59% in H1 FY26, although EBITDA rose 31.45% year on year to Rs 12.7463 crore from Rs 9.6969 crore.
H1 FY27 revenue from operations increased 31.38% year on year to Rs 72.2696 crore from Rs 55.0063 crore. PAT rose 38.58% to Rs 6.2798 crore from Rs 4.5315 crore, and PAT margin increased by 45 basis points to 8.67% from 8.22%.
What do Kheria Autocomp’s cash flow and balance sheet show?
Kheria Autocomp generated net cash from operating activities of Rs 26.0288 crore in FY26, compared with Rs 8.3994 crore in FY25 and Rs 9.8222 crore in FY24. The FY26 operating cash flow exceeded the year’s Rs 11.4233 crore PAT, while investing activities used Rs 26.6440 crore of cash.
Investing cash outflow was Rs 17.9772 crore in FY25 and Rs 15.3329 crore in FY24, making FY26 the largest investing outflow in the three reported years. Financing activities provided Rs 85.59 lakh in FY26, compared with Rs 9.6893 crore in FY25, and closing cash and cash equivalents were Rs 56.83 lakh, up from Rs 32.76 lakh.
Property, plant and equipment stood at Rs 55.5196 crore in FY26, versus Rs 52.7534 crore in FY25 and Rs 39.5254 crore in FY24. Capital work-in-progress was Rs 18.4115 crore in FY26, while the presentation shows no balance in this line for FY25 or FY24.
Long-term borrowings rose to Rs 26.6550 crore in FY26 from Rs 15.9527 crore in FY24, and current borrowings increased to Rs 8.3709 crore from Rs 2.8735 crore. The current ratio was 0.82 times in FY26, below 0.99 times in FY25 but above 0.72 times in FY24, while asset turnover rose to 2.22 times from 1.88 times.
Conclusion
Kheria Autocomp’s FY24-FY26 accounts show that growth in revenue was accompanied by higher operating and net margins. Revenue from operations increased by Rs 57.6954 crore, EBITDA increased by Rs 13.1357 crore and PAT increased by Rs 8.1168 crore, with EBITDA margin rising from 15.7% to 19.1% and net profit margin from 5.3% to 9.5%.
The next results will show whether the FY26 annual EBITDA margin of 19.1% can be sustained after H1 FY27 recorded 17.60%. The presentation also records Rs 18.4115 crore of capital work-in-progress, Rs 26.6440 crore of FY26 investing cash outflow and Rs 26.6550 crore of long-term borrowings, making subsequent asset, cash flow and funding movements relevant items to watch.