










KKCL revenue nearly doubled by FY26 while ROE fell from peak
Key highlights
- KKCL revenue increased from Rs 608 crore in FY22 to Rs 1,213 crore in FY26.
- KKCL EBITDA rose from Rs 100 crore in FY22 to Rs 238 crore in FY26.
- KKCL ROE declined from 25.2% in FY24 to 17.3% in FY26.
- KKCL reported net cash of Rs 338 crore at September 30, 2026.
powered by IRIS
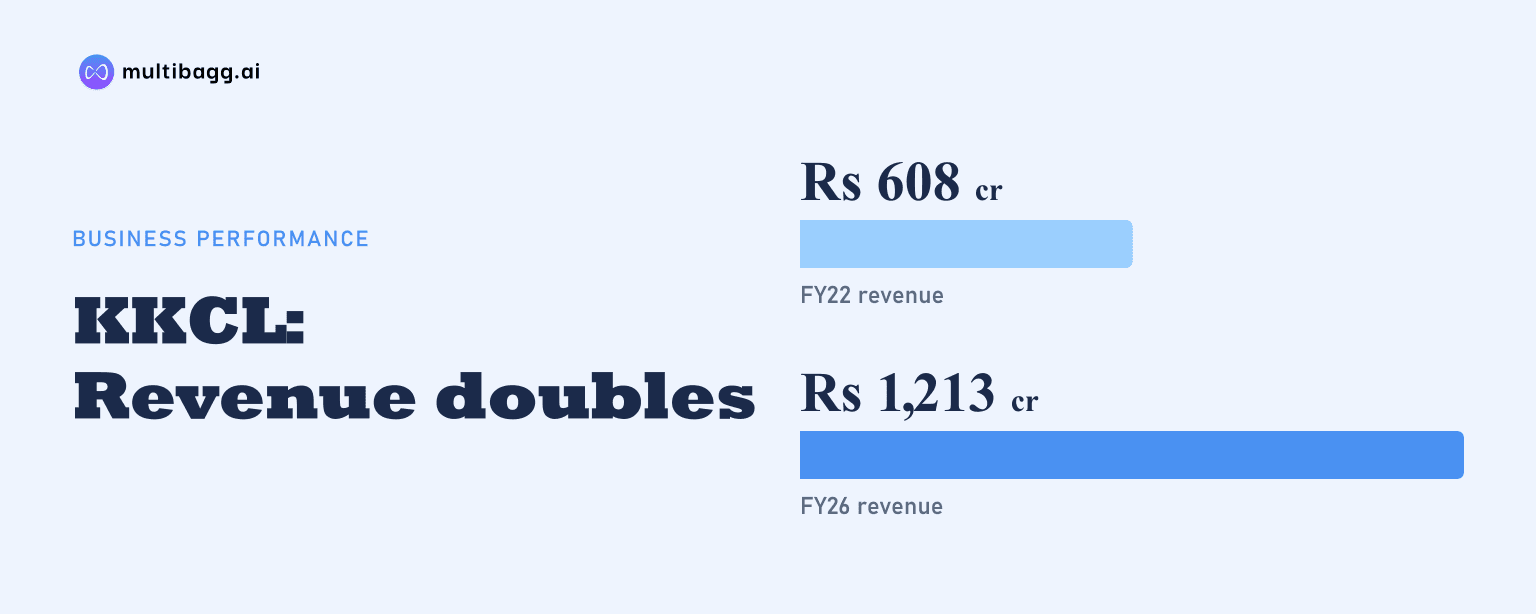
Kewal Kiran Clothing Limited (KKCL) reported Rs 1,213 crore of revenue in FY26, nearly double Rs 608 crore in FY22, but return on equity (ROE) fell to 17.3% from its 25.2% FY24 peak. Earnings before interest, tax, depreciation and amortisation (EBITDA) rose to Rs 238 crore, while profit margins and working-capital days did not return to their FY24 levels.
Know Kewal Kiran Clothing inside out
Results, valuation, peers and who's buying, in one view.
How quickly did KKCL revenue and volumes grow?
KKCL increased revenue by Rs 605 crore between FY22 and FY26, taking reported revenue from Rs 608 crore to Rs 1,213 crore. The company reports a 19% compound annual growth rate (CAGR) for revenue over the five financial years. Revenue rose each year, reaching Rs 779 crore in FY23, Rs 860 crore in FY24 and Rs 1,003 crore in FY25 before the FY26 result.
Volume sales also increased from 90 lakh units in FY22 to 180 lakh units in FY26, a reported 19.0% CAGR. Volumes rose by 34 lakh units in FY25, from 134 lakh units in FY24 to 168 lakh units, before adding a further 12 lakh units in FY26. Sales realisation declined from Rs 674 in FY22 to Rs 595 in FY25, then recovered to Rs 668 in FY26.
The revenue increase was accompanied by a channel shift. Retail represented 56% of FY26 revenue, compared with 42% in FY22, while non-retail declined to 44% from 58%. KKCL defines retail as exclusive brand outlets (EBOs) and large-format stores (LFS), while non-retail includes multi-brand outlets, e-commerce, factory outlets and exports.
How did KKCL margins and returns change after FY24?
KKCL’s EBITDA rose from Rs 100 crore in FY22 to Rs 238 crore in FY26, a reported 24% CAGR that exceeded the 19% revenue CAGR. Its EBITDA margin improved from 16% in FY22 to 21% in FY24, then declined to 19% in FY25 and recovered partially to 20% in FY26. The FY26 margin was therefore 1 percentage point below the FY24 level.
Profit after tax (PAT) rose from Rs 82 crore in FY22 to Rs 153 crore in FY26, although it did not exceed the Rs 154 crore reported in FY24. PAT margin followed a different path from revenue growth: it rose from 13% in FY22 to 17% in FY24, then fell to 14% in FY25 and 12% in FY26. The FY26 PAT figure was Rs 1 crore below FY24 despite Rs 353 crore more revenue.
ROE rose from 17.9% in FY22 to 23.2% in FY23 and 25.2% in FY24, before declining to 20.0% in FY25 and 17.3% in FY26. The decline after FY24 coincided with PAT remaining broadly unchanged at Rs 154 crore in FY24 and Rs 153 crore in FY26, while total equity expanded from Rs 676 crore at March 2024 to Rs 1,119 crore at March 2026.
In the consolidated profit and loss statement, depreciation and amortisation increased from Rs 10 crore in FY24 to Rs 44 crore in FY26. Other income declined from Rs 37 crore to Rs 24 crore over the same period, while finance cost rose from Rs 4 crore to Rs 15 crore. Gross profit margin was more stable, ranging from 41% in FY22 to 43% in FY24 and ending at 42% in FY26.
Got a follow-up? Ask IRIS
What changed in KKCL working capital and operating cash flow?
KKCL’s working-capital days improved from 138 days in FY22 to 102 days in FY24, then increased to 148 days in FY25 and stood at 144 days in FY26. The company states that FY25 working-capital days are adjusted for Kraus annualised sales numbers. FY26 working-capital days were 42 days above the FY24 level.
The cash-flow record reflected the movement in working capital. Changes in working capital used Rs 10 crore in FY24, Rs 141 crore in FY25 and Rs 10 crore in FY26. Cash generated from operations consequently fell from Rs 175 crore in FY24 to Rs 48 crore in FY25, before increasing to Rs 228 crore in FY26.
Net cash from operating activities dropped from Rs 136 crore in FY24 to Rs 13 crore in FY25 and then increased to Rs 183 crore in FY26. The FY25 result also included Rs 184 crore of net cash used in investing activities, compared with Rs 10 crore in FY24 and Rs 28 crore in FY26. Net cash from financing activities remained negative in all five years, including Rs 51 crore in FY26.
How did KKCL balance sheet items change?
KKCL reported total assets of Rs 1,496 crore at March 2026, compared with Rs 837 crore at March 2024. Current assets increased from Rs 684 crore to Rs 943 crore across those dates. Inventories rose from Rs 82 crore to Rs 258 crore, while trade receivables increased from Rs 203 crore to Rs 321 crore.
Non-current assets rose from Rs 153 crore at March 2024 to Rs 553 crore at March 2026. The March 2026 balance sheet included Rs 119 crore of goodwill and Rs 110 crore of other intangible assets, whereas goodwill was absent and other intangible assets were nil at March 2024. Property, plant and equipment increased from Rs 97 crore to Rs 175 crore over the same period.
Shareholders’ funds increased from Rs 676 crore at March 2024 to Rs 938 crore at March 2026, while total equity reached Rs 1,119 crore after including Rs 181 crore of non-controlling interest. Current borrowings moved from Rs 2 crore at March 2024 to Rs 108 crore at March 2025, then declined to Rs 48 crore at March 2026. Lease liabilities totalled Rs 80 crore at March 2026 across current and non-current liabilities.
What is KKCL latest reported cash position and distribution reach?
KKCL reported net cash of Rs 338 crore at September 30, 2026, up from Rs 304 crore at March 31, 2026. The September figure comprised Rs 384 crore of cash and investments and Rs 46 crore of total debt. KKCL states that this measure includes investments but excludes its investment in the joint venture.
The company listed 675 EBOs as of September 2026, led by 477 Killer stores, with 80 K-Lounge stores, 80 Lawman plus Integriti stores, 37 Kraus stores and one factory outlet. It also reported more than 80 distributors covering more than 3,000 multi-brand outlets and more than 2,700 LFS counters. The 56% retail revenue share in FY26 was 14 percentage points above FY22.
Jeans remained the largest product category at 48% of FY26 revenue, but its share was lower than 56% in FY22. Shirts rose from 18% to 22% over the same period, while trousers increased from 8% to 10% and T-shirts from 5% to 6%. Other products represented 13% of revenue in both FY22 and FY26.
Conclusion
KKCL’s five-year record shows revenue rising by Rs 605 crore and sales volume doubling to 180 lakh units, while EBITDA increased by Rs 138 crore. The comparison also shows that FY24 marked the high point for EBITDA margin, PAT margin and ROE, whereas FY26 delivered higher revenue and operating cash flow but a 17.3% ROE and 12% PAT margin.
The next disclosed marker is the September 30, 2026 net cash position of Rs 338 crore, against total debt of Rs 46 crore. Investors can watch whether working-capital days, which were 144 in FY26, move closer to the 102 days reported in FY24 and whether the FY26 retail revenue share of 56% is accompanied by changes in margins and cash generation.