










KKC H1 FY27 revenue rose 11% despite 2% volume decline
Key highlights
- KKC H1 FY27 revenue increased 11% year on year to Rs 652 crore despite a 2% decline in quantity sales to 86 lakh units.
- KKC H1 FY27 EBITDA rose 19% to Rs 133 crore and EBITDA margin increased to 20% from 19%.
- KKC apparel realisation increased to Rs 881 per unit from Rs 869, while accessories realisation rose to Rs 153 from Rs 112.
- Retail contributed 57% of KKC H1 FY27 sales, compared with 54% a year earlier, and EBO stores reached 675 in Q2 FY27.
powered by IRIS
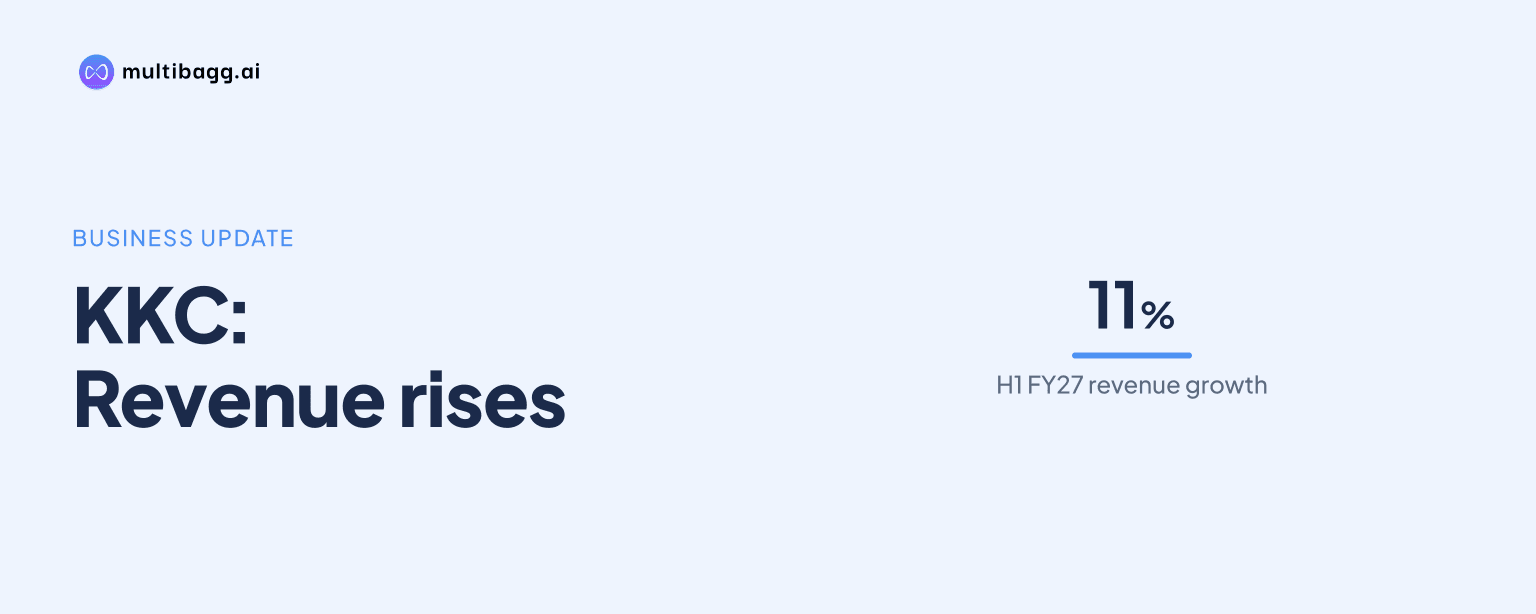
Kewal Kiran Clothing Limited, or KKC, reported H1 FY27 revenue of Rs 652 crore, up 11% year on year, although quantity sales fell 2% to 86 lakh units. Higher apparel and accessories realisations, a greater apparel share of unit sales and retail’s larger sales contribution coincided with EBITDA margin increasing to 20% from 19%.
Know Kewal Kiran Clothing inside out
Results, valuation, peers and who's buying, in one view.
How did KKC’s H1 FY27 financial results change?
KKC’s H1 FY27 revenue from operations increased by Rs 64 crore to Rs 652 crore from Rs 588 crore in H1 FY26, while earnings before interest, tax, depreciation and amortisation, or EBITDA, rose by Rs 20 crore to Rs 133 crore. Profit after tax, or PAT, increased by Rs 15 crore to Rs 94 crore from Rs 79 crore.
Profit growth exceeded revenue growth in percentage terms during H1 FY27. Gross profit rose 13% to Rs 280 crore from Rs 248 crore, EBITDA increased 19% from Rs 113 crore, and PAT rose 19% from Rs 79 crore. Gross profit margin increased to 43% from 42%, EBITDA margin rose to 20% from 19%, and PAT margin reached 14% from 13%.
KKC’s Q2 FY27 results also showed year-on-year growth, with revenue increasing 5% to Rs 373 crore from Rs 354 crore in Q2 FY26. Q2 EBITDA rose 12% to Rs 80 crore and its margin rose to 21% from 20%, while Q2 PAT increased 15% to Rs 54 crore and its margin reached 14% from 13%.
What drove KKC revenue growth while unit volumes declined?
KKC recorded H1 FY27 quantity sales of 86 lakh units, down from 88 lakh units in H1 FY26, while revenue increased to Rs 652 crore from Rs 588 crore. The reported 11% sales growth therefore occurred with lower aggregate unit volume rather than an increase in units sold.
The presentation reported higher sales realisation in both disclosed product groups. Apparel sales realisation increased to Rs 881 per unit in H1 FY27 from Rs 869 per unit in H1 FY26, while accessories sales realisation rose to Rs 153 per unit from Rs 112 per unit. Apparel accounted for 83% of total quantity sales, compared with 73% a year earlier.
The Q2 movement was more pronounced in volume terms. Q2 FY27 quantity sales were 47 lakh units, down from 55 lakh units in Q2 FY26, although revenue rose 5% to Rs 373 crore. Quarterly apparel realisation increased to Rs 904 per unit from Rs 861 per unit, and accessories realisation rose to Rs 156 per unit from Rs 108 per unit.
KKC’s H1 FY27 operating matrix also shows cost of goods sold, or COGS, at 57% of net sales, compared with 58% in H1 FY26. This one-percentage-point change accompanied the rise in gross profit margin to 43% from 42%, but the presentation does not separately quantify the impact of price, product mix or sourcing on that movement.
How did KKC’s product mix change in H1 FY27?
KKC’s H1 FY27 sales mix shifted away from jeans and trousers towards other categories, although jeans remained its largest product category at 48% of sales. Jeans represented 50% of sales in H1 FY26, trousers fell to 9% from 11%, and shirts remained unchanged at 21%.
The others category recorded the largest H1 mix increase, reaching 13% of sales from 11% in H1 FY26. T-shirts increased to 8% from 7%, alongside the 10-percentage-point increase in apparel’s proportion of total quantity sales to 83% and the Rs 12 increase in apparel realisation per unit.
The Q2 product mix changed more sharply than the half-year mix. Jeans accounted for 47% of Q2 FY27 sales against 49% a year earlier, while trousers declined to 8% from 12%. Others rose to 17% from 10%, and T-shirts increased to 9% from 7%, during a quarter when unit sales declined by 8 lakh.
KKC did not disclose category-level revenue or unit sales values for H1 FY27, only each category’s percentage of sales. The available data therefore show that jeans, shirts, trousers, T-shirts and others had differing shares within the Rs 652 crore H1 revenue total, without quantifying each category’s absolute sales contribution.
Got a follow-up? Ask IRIS
Which channels accounted for KKC’s H1 FY27 sales?
KKC generated 57% of H1 FY27 sales through retail, compared with 54% in H1 FY26, while non-retail’s share declined to 43% from 46%. The presentation defines retail as exclusive brand outlets, or EBOs, and large-format stores, or LFS, while non-retail includes multi-brand outlets, e-commerce, factory outlets and exports.
The three-percentage-point retail mix increase occurred as H1 FY27 revenue rose by Rs 64 crore. Retail also increased its share in Q2 FY27, although by one percentage point, to 55% from 54% in Q2 FY26. Non-retail represented 45% of Q2 FY27 sales, compared with 46% in the prior-year quarter.
KKC reported 675 EBO stores in Q2 FY27, compared with 670 in Q1 FY27, and listed five additions in Q2 after four additions in Q1. The disclosed store count provides context for retail’s 57% H1 sales share, but the presentation does not provide EBO revenue, same-store sales or profitability by channel.
The EBO network had expanded from 356 stores in FY22 to 675 stores in Q2 FY27, based on the presentation’s reported store numbers. The source lists net additions of 97 in FY23, 35 in FY24, 121 in FY25 and 57 in FY26, but does not state a full-year FY27 store-opening target.
How did KKC’s costs and balance sheet change by September 2026?
KKC’s H1 FY27 COGS increased by Rs 32 crore to Rs 372 crore from Rs 340 crore, against a Rs 64 crore increase in revenue. Employee expenses rose to Rs 92 crore from Rs 84 crore, administrative and other expenses increased to Rs 26 crore from Rs 22 crore, and selling and distribution expenses declined to Rs 28 crore from Rs 29 crore.
Selling and distribution expense represented 4% of H1 FY27 sales, down from 5% in H1 FY26, while employee expense remained at 14% and administrative and other expense remained at 4%. These movements accompanied EBITDA of Rs 133 crore and a 20% EBITDA margin, compared with Rs 113 crore and a 19% margin a year earlier.
Total assets stood at Rs 1,610 crore at September 2026, compared with Rs 1,496 crore at March 2026. Current assets increased to Rs 1,096 crore from Rs 943 crore, including trade receivables of Rs 406 crore versus Rs 321 crore, inventories of Rs 272 crore versus Rs 258 crore, and cash and cash equivalents of Rs 257 crore versus Rs 176 crore.
Total equity increased to Rs 1,202 crore at September 2026 from Rs 1,119 crore at March 2026, while total liabilities rose to Rs 408 crore from Rs 377 crore. Current borrowings were Rs 46 crore at September 2026 versus Rs 48 crore at March 2026, and trade payables increased to Rs 142 crore from Rs 99 crore.
Conclusion
KKC’s H1 FY27 results show that revenue and profit growth occurred despite a 2% decline in quantity sales. Revenue rose 11% to Rs 652 crore, while apparel realisation rose to Rs 881 per unit, accessories realisation reached Rs 153 per unit, retail contributed 57% of sales and EBITDA margin increased by one percentage point to 20%.
The next disclosed results will show whether KKC can sustain revenue growth while volume remains below the prior-year level. The presentation provides no FY27 store-opening target or channel-profitability guidance, leaving subsequent disclosures on quantity sales, product realisation, retail mix and EBO additions as the measures to watch after the network reached 675 stores in Q2 FY27.