










JK Lakshmi Cement net debt rises by 60% to Rs 2,027 crore
Key highlights
- JK Lakshmi Cement’s net debt increased Rs 761 crore to Rs 2,027 crore between 31 March 2026 and 30 September 2026.
- Cash fell Rs 614 crore to Rs 611 crore, while gross debt rose Rs 147 crore to Rs 2,638 crore.
- Net-debt-to-EBITDA increased from 1.12 times at March-end to 2.31 times at September-end.
- Q2 FY 27 EBITDA was Rs 154 crore, down from Rs 259 crore in Q1 FY 27.
powered by IRIS
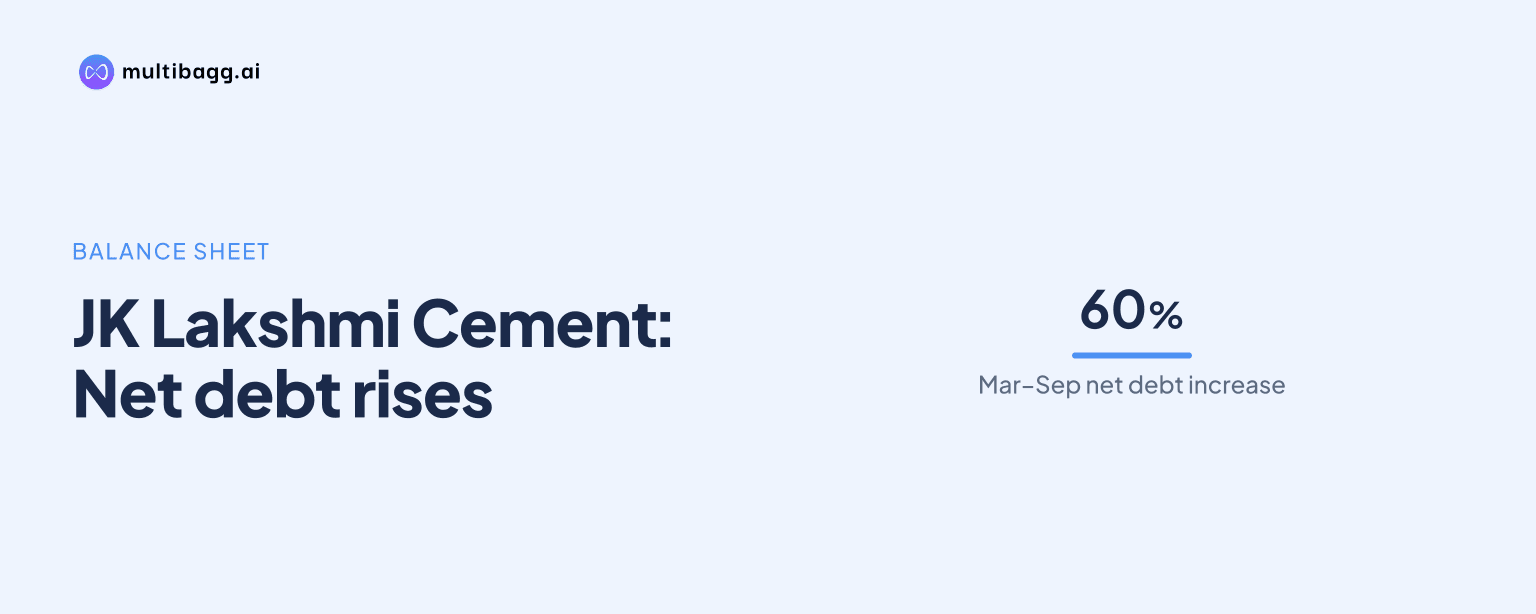
JK Lakshmi Cement Ltd.’s net debt rose 60% to Rs 2,027 crore at 30 September 2026 from Rs 1,266 crore at 31 March 2026, as cash fell Rs 614 crore to Rs 611 crore and gross debt increased Rs 147 crore. Net-debt-to-EBITDA rose to 2.31 times from 1.12 times over the six months.
Know JK Lakshmi Cement inside out
Results, valuation, peers and who's buying, in one view.
Why did JK Lakshmi Cement’s net debt rise?
JK Lakshmi Cement’s net debt rose because its Rs 614 crore fall in cash was substantially larger than its Rs 147 crore increase in gross debt between 31 March 2026 and 30 September 2026. Gross debt reached Rs 2,638 crore at the September date, compared with Rs 2,491 crore at March-end. Cash declined from Rs 1,225 crore to Rs 611 crore over the same period.
The combined movement resulted in net debt increasing Rs 761 crore, from Rs 1,266 crore to Rs 2,027 crore. The net-debt increase was about 60% over six months. Cash at 30 September 2026 was Rs 614 crore lower than the March-end balance, while gross debt was Rs 147 crore higher, showing that the cash movement accounted for most of the change in net debt.
JK Lakshmi Cement’s debt-profile disclosure reports the balances at two dates but does not state how the Rs 614 crore reduction in cash was used. It also does not provide a breakup of the Rs 2,638 crore gross debt by instrument, maturity, interest cost or currency on the supplied pages. The presentation therefore establishes the balance-sheet changes, but not the individual transactions behind them.
How did JK Lakshmi Cement’s leverage ratios change?
JK Lakshmi Cement’s net-debt-to-EBITDA ratio increased to 2.31 times at 30 September 2026 from 1.12 times at 31 March 2026. EBITDA means earnings before interest, taxes, depreciation and amortisation. The ratio increased by 1.19 times and was more than double the March-end level as reported net debt rose Rs 761 crore.
Net debt to equity also increased, reaching 0.51 times at 30 September 2026 from 0.32 times at 31 March 2026. That represents an increase of 0.19 times during the six months. Both reported leverage measures moved upward, although the presentation does not disclose the underlying equity amount or the EBITDA period used in calculating the net-debt-to-EBITDA ratio.
The two ratios measure net debt against different bases. Net debt to EBITDA moved from 1.12 times to 2.31 times, while net debt to equity moved from 0.32 times to 0.51 times. The common balance-sheet input was net debt of Rs 2,027 crore at 30 September 2026, compared with Rs 1,266 crore six months earlier.
Got a follow-up? Ask IRIS
What operating performance accompanied higher leverage?
JK Lakshmi Cement reported lower quarterly profitability in Q2 FY 27 than in both Q1 FY 27 and Q2 FY 26. EBITDA, labelled EBIDTA in the presentation and stated as excluding other income, was Rs 154 crore in Q2 FY 27. That was 40% below Rs 259 crore in Q1 FY 27 and 26% below Rs 208 crore in Q2 FY 26.
Net sales were Rs 1,617 crore in Q2 FY 27, down 15% from Rs 1,905 crore in Q1 FY 27 but up 6% from Rs 1,532 crore in Q2 FY 26. Profit before tax was Rs 29 crore, compared with Rs 140 crore in the preceding quarter and Rs 105 crore a year earlier. Profit after tax was Rs 21 crore, versus Rs 107 crore in Q1 FY 27 and Rs 82 crore in Q2 FY 26.
Earnings per share were Rs 1.68 in Q2 FY 27, compared with Rs 8.60 in Q1 FY 27 and Rs 6.63 in Q2 FY 26. EBITDA per tonne was Rs 517, down from Rs 719 in Q1 FY 27 and Rs 732 in Q2 FY 26. The presentation reports quarter-on-quarter and year-on-year declines of 28% and 29%, respectively, in EBITDA per tonne.
Power consumption was 72 kilowatt-hours per metric tonne of cement in Q2 FY 27, unchanged from Q1 FY 27 and above 70 kilowatt-hours per metric tonne in Q2 FY 26. The September 2026 debt position therefore coincided with a quarter in which EBITDA, profit after tax and EBITDA per tonne were all lower than in the immediately preceding quarter.
What debt reduction plan does JK Lakshmi Cement disclose?
JK Lakshmi Cement does not disclose a debt-repayment target, refinancing plan, capital-expenditure amount or debt-maturity schedule on the supplied debt-profile pages. Those pages report gross debt of Rs 2,638 crore, cash of Rs 611 crore and net debt of Rs 2,027 crore at 30 September 2026, without a management target for debt or cash after that date.
The supplied presentation separately sets out sustainability targets, rather than a funding or deleveraging plan. In H1 FY 2026-27, the green-power mix was 49%, with a stated FY30 goal of 60%. Low-carbon products accounted for 65%, against a stated FY30 goal of 75% blended cement.
JK Lakshmi Cement also reported greenhouse-gas intensity of 603 kilograms of carbon-dioxide equivalent per tonne of cementitious material in H1 FY 2026-27, down 1% year on year. Its water-positive measure was 4.66 times, against a stated FY30 goal of seven times. The presentation does not link these operating targets to a debt amount, cash requirement or future leverage objective.
Conclusion
JK Lakshmi Cement’s six-month balance-sheet movement reflects both a lower cash balance and higher borrowings: cash fell Rs 614 crore, gross debt rose Rs 147 crore and net debt increased Rs 761 crore by 30 September 2026. The rise in net debt occurred alongside Q2 FY 27 EBITDA of Rs 154 crore, below both the Rs 259 crore recorded in Q1 FY 27 and Rs 208 crore in Q2 FY 26.
The next disclosed milestones are the FY30 targets of a 60% green-power mix and 75% blended cement, compared with H1 FY 2026-27 levels of 49% and 65%, respectively. The supplied material does not state a debt-reduction target, repayment schedule or financing plan, leaving subsequent disclosures on cash, gross debt and leverage ratios as the relevant measures to monitor.