










JK Lakshmi Cement targets 25.1 MTPA by FY30, led by East
Key highlights
- JK Lakshmi Cement projects grey cement capacity of 25.1 MTPA in FY30, versus 18.0 MTPA in FY26.
- JK Lakshmi Cement’s East capacity is projected to increase by 5.6 MTPA, from 3.5 MTPA in FY26 to 9.1 MTPA in FY30.
- JK Lakshmi Cement projects a 4.6 MTPA increase in FY28, taking all-India capacity to 22.6 MTPA.
- JK Lakshmi Cement reported Q2 FY27 sales of 29.83 lakh tonnes and capacity utilisation of 62%.
powered by IRIS
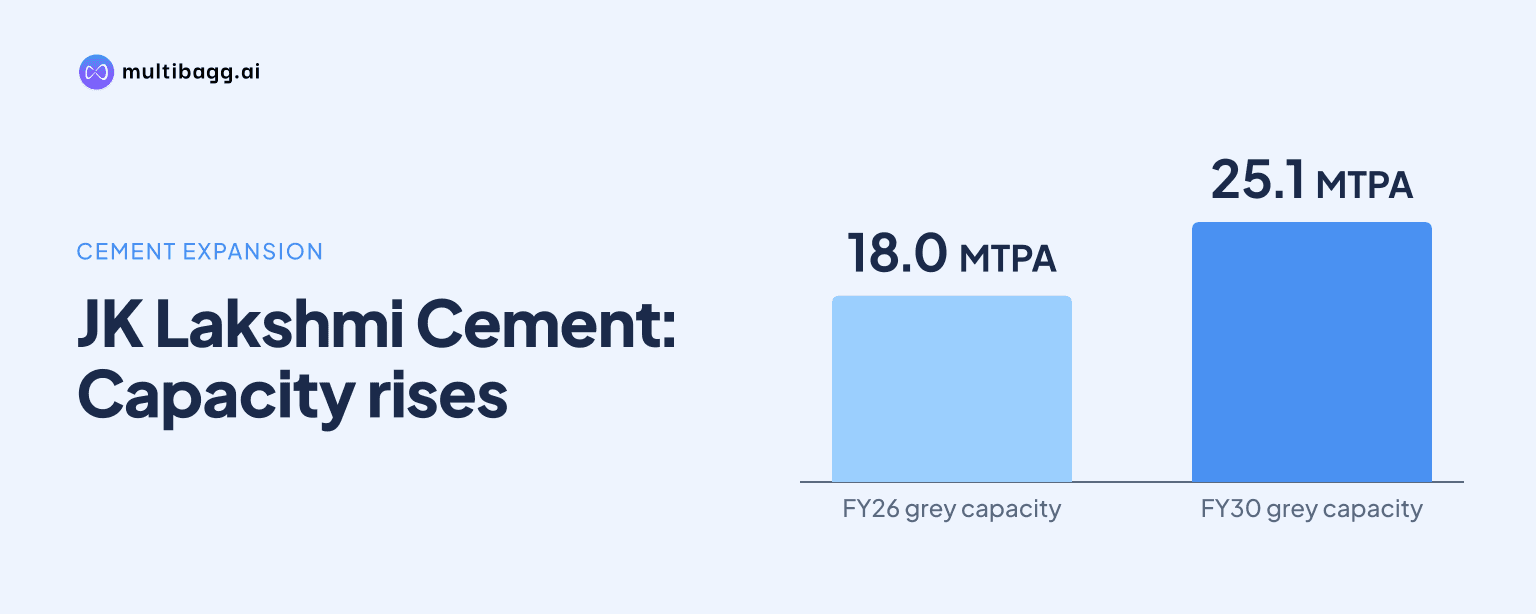
JK Lakshmi Cement Ltd. projects 25.1 million tonnes per annum (MTPA) of grey cement capacity by fiscal year (FY) 30, up from 18.0 MTPA in FY26, with 5.6 MTPA of the planned 7.1 MTPA increase allocated to the East. North and West are projected to remain unchanged.
Know JK Lakshmi Cement inside out
Results, valuation, peers and who's buying, in one view.
How does JK Lakshmi Cement plan to reach 25.1 MTPA by FY30?
JK Lakshmi Cement plans to increase all-India grey cement capacity by 7.1 MTPA between FY26 and FY30, from 18.0 MTPA to 25.1 MTPA. Its published schedule shows capacity remaining at 18.0 MTPA in FY27, then rising to 22.6 MTPA in FY28, 23.6 MTPA in FY29 and 25.1 MTPA in FY30; the FY28 to FY30 figures are projected.
The biggest planned increase is 4.6 MTPA in FY28 versus FY27. That step comprises a 3.1 MTPA rise in East capacity and 1.5 MTPA of capacity in Central, while North remains at 10.9 MTPA and West at 3.6 MTPA. The all-India capacity base had already increased from 16.5 MTPA in FY25 to 18.0 MTPA in FY26.
Why is JK Lakshmi Cement’s growth concentrated in the East?
JK Lakshmi Cement’s East capacity is projected to increase by 5.6 MTPA, from 3.5 MTPA in FY26 to 9.1 MTPA in FY30. This is the larger part of the 7.1 MTPA all-India increase, compared with the 1.5 MTPA Central addition. East would therefore move from the smallest disclosed operating zone in FY26 to the second-largest zone by FY30, behind North’s 10.9 MTPA.
The Central zone is projected to appear at 1.5 MTPA in FY28 and remain at that level through FY30. By contrast, North is shown at 10.9 MTPA in FY26 and every projected year, while West remains at 3.6 MTPA. The expansion plan changes the production footprint through additions in East and Central rather than through reductions in North or West.
East capacity is scheduled to increase in three stages. It rises by 3.1 MTPA to 6.6 MTPA in FY28, by a further 1.0 MTPA to 7.6 MTPA in FY29, and by 1.5 MTPA to 9.1 MTPA in FY30. The FY29 and FY30 all-India increases match the East additions because no changes are listed for the other three zones in those years.
What is JK Lakshmi Cement’s expansion timetable?
JK Lakshmi Cement’s timetable has no total-capacity increase in FY27, followed by a projected 4.6 MTPA increase in FY28. The company then projects additions of 1.0 MTPA in FY29 and 1.5 MTPA in FY30. This places 6.1 MTPA, or most of the 7.1 MTPA FY26-to-FY30 increase, in the FY28 to FY30 period.
The presentation identifies Durg Line II and Madhubani as expansion projects, but the supplied material does not allocate their capacity to the zone schedule. It also does not disclose project-level capital cost or commissioning dates. A Durg packing-plant image carries the date and time of 11 September 2026 at 10:45, while the project pages otherwise provide status imagery rather than operating specifications.
The absence of disclosed project-level details means the published zone targets are the available measure of the planned build-out. The FY28 schedule shows East at 6.6 MTPA and Central at 1.5 MTPA, compared with 3.5 MTPA in East and no Central capacity listed in FY26. The presentation labels FY28, FY29 and FY30 capacity figures as projected.
Got a follow-up? Ask IRIS
How were JK Lakshmi Cement’s volumes and utilisation before expansion?
JK Lakshmi Cement reported sales of 29.83 lakh tonnes in the second quarter (Q2) of FY27, 5% above 28.43 lakh tonnes in Q2 FY26 but 17% below 35.98 lakh tonnes in the first quarter (Q1) of FY27. The presentation identifies both the year-on-year and quarter-on-quarter changes, showing that Q2 volume improved from the prior-year quarter but declined from Q1 FY27.
Capacity utilisation was 62% in Q2 FY27, compared with 65% in Q2 FY26 and 76% in Q1 FY27, on total annual cement capacity of 18.0 MT. The Q2 FY27 rate was therefore 3 percentage points below the prior-year quarter and 14 percentage points below Q1 FY27. These operating figures relate to the existing 18.0 MT capacity base, before the projected move to 22.6 MTPA in FY28.
JK Lakshmi Cement’s Q2 FY27 sales composition was 58% trade and 42% non-trade, while bag sales represented 82% and bulk sales 18%. Direct dispatches accounted for 76% of sales, versus 24% through depots, and road carried 93% of volumes compared with 7% by rail. The presentation provides these channel figures as current sales and distribution metrics, not as stated outcomes of the FY30 capacity plan.
What industry conditions does JK Lakshmi Cement identify for FY27?
JK Lakshmi Cement’s presentation estimates Indian cement-industry volume growth of 8% to 9% in the first half of FY27 and demand growth of about 8% for the full year. It places industry utilisation at about 70% on an estimated 710 MTPA capacity base, with 42 MT to 50 MT expected to be added during FY27. Housing accounts for 60% to 65% of demand, according to the presentation.
The company identifies public capital-expenditure momentum and goods and services tax support for affordable housing as demand supports. It also lists elevated energy prices, El Niño risk, weaker rural demand, higher inflation and tighter money as pressures or risks. These industry conditions provide the context for the FY28 to FY30 projected additions, but the presentation does not link a specific demand forecast to Durg Line II or Madhubani.
On the macroeconomic page, consumer price inflation was 5.54% in September 2026 and the policy repo rate was 5.50% after a 25-basis-point increase on 7 October 2026. The presentation says the rate increase was the first since February 2023 and notes that calibrated tightening can raise borrowing costs for housing and capital expenditure. These figures sit alongside the company’s FY27 industry-demand estimate of about 8%.
Conclusion
JK Lakshmi Cement’s projected increase to 25.1 MTPA by FY30 would add 7.1 MTPA to its FY26 base and shift capacity growth toward the East. East is scheduled to add 5.6 MTPA, Central 1.5 MTPA, while North remains at 10.9 MTPA and West at 3.6 MTPA under the published plan.
The next stated capacity milestone is 22.6 MTPA in FY28, followed by 23.6 MTPA in FY29 and 25.1 MTPA in FY30. Durg Line II and Madhubani are identified as expansion projects, but their individual capacities, costs and commissioning dates remain undisclosed in the supplied presentation.