










Kewal Kiran Clothing Limited EBITDA grew faster than revenue
Key highlights
- Kewal Kiran’s revenue rose to Rs 1,213 crore in FY26 from Rs 608 crore in FY22, a stated 19% CAGR.
- Kewal Kiran’s EBITDA increased to Rs 238 crore in FY26 from Rs 100 crore in FY22, a stated 24% CAGR.
- Kewal Kiran’s PAT margin declined to 12% in FY26 from its FY24 peak of 17%.
- Kewal Kiran reported 147 working-capital days in FY26, compared with 102 days in FY24.
powered by IRIS
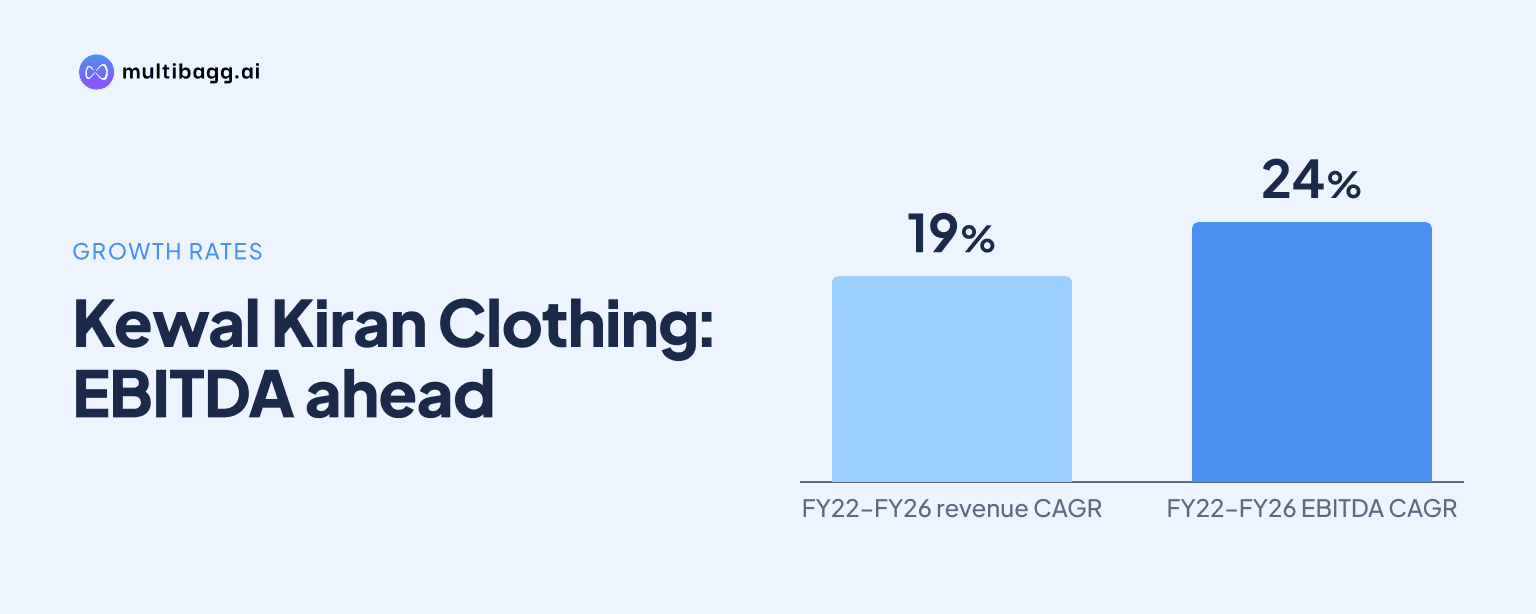
Kewal Kiran Clothing Limited reported a 24% EBITDA compound annual growth rate, or CAGR, from FY22 to FY26, exceeding its 19% revenue CAGR, but PAT margin declined to 12% in FY26 from 17% in FY24 and return on equity fell to 17.3% from 25.2%.
Know Kewal Kiran Clothing inside out
Results, valuation, peers and who's buying, in one view.
How fast did Kewal Kiran grow between FY22 and FY26?
Kewal Kiran increased revenue to Rs 1,213 crore in FY26 from Rs 608 crore in FY22, while EBITDA rose to Rs 238 crore from Rs 100 crore. The company reports a 19% revenue CAGR for the four-year period, compared with a 24% EBITDA CAGR. Operating profit therefore grew faster than sales over the full FY22-FY26 period.
Growth was not uniform each year. Revenue increased from Rs 861 crore in FY24 to Rs 1,003 crore in FY25 and Rs 1,213 crore in FY26, while EBITDA moved from Rs 177 crore to Rs 191 crore and then Rs 238 crore. EBITDA margin was 16% in FY22, reached 21% in FY24, declined to 19% in FY25 and recovered to 20% in FY26, according to the consolidated profit and loss statement.
Kewal Kiran’s volume sales quantity rose to 180 lakh units in FY26 from 90 lakh units in FY22, at a stated 19.0% CAGR. Sales realisation was Rs 668 in FY26, compared with Rs 674 in FY22, after declining to Rs 595 in FY25. The FY26 revenue increase thus coincided with both a 12 lakh-unit increase in sales volume and a Rs 73 improvement in realisation from FY25.
What changed in Kewal Kiran’s operating margins?
Kewal Kiran’s gross profit margin increased to 42% in FY26 from 41% in FY22, although it remained below the 43% recorded in FY24. Gross profit rose to Rs 512 crore in FY26 from Rs 249 crore in FY22, while cost of goods sold increased to Rs 701 crore from Rs 359 crore. EBITDA margin improved by four percentage points over the same four-year period, from 16% to 20%.
Expenses increased as sales expanded. Employee expenses rose to Rs 172 crore in FY26 from Rs 80 crore in FY22, selling and distribution expenses rose to Rs 56 crore from Rs 34 crore, and administrative and other expenses increased to Rs 46 crore from Rs 35 crore. These three expense lines totalled Rs 274 crore in FY26, compared with Rs 149 crore in FY22, while EBITDA increased by Rs 138 crore.
The FY24-to-FY26 comparison separates operating expansion from the post-tax outcome. Revenue increased by Rs 352 crore from FY24 to FY26 and EBITDA rose by Rs 61 crore, while EBITDA margin moved down by one percentage point from 21% to 20%. Retail, defined by the company as exclusive brand outlets and large-format stores, represented 56% of FY26 revenue, up from 47% in FY24; non-retail declined to 44% from 53%.
Got a follow-up? Ask IRIS
Why did Kewal Kiran’s PAT margin fall after FY24?
Kewal Kiran’s PAT margin fell to 12% in FY26 from 17% in FY24 alongside lower other income and higher depreciation, amortisation, finance cost and tax. PAT was Rs 153 crore in FY26, marginally below Rs 154 crore in FY24, despite revenue increasing to Rs 1,213 crore from Rs 861 crore over those two years.
Other income declined to Rs 24 crore in FY26 from Rs 37 crore in FY24, while depreciation and amortisation increased to Rs 44 crore from Rs 10 crore. Finance cost rose to Rs 15 crore from Rs 4 crore, and tax increased to Rs 50 crore from Rs 45 crore. EBIT, or earnings before interest and tax, increased to Rs 217 crore in FY26 from Rs 204 crore in FY24, while its margin fell to 18% from 23%.
Profit before tax was Rs 203 crore in FY26 compared with Rs 199 crore in FY24, despite EBITDA being Rs 61 crore higher. The difference between operating and post-tax growth is visible in the reported FY22-FY26 CAGRs: EBITDA grew at 24%, while PAT grew at 17%. PAT margin had already declined to 14% in FY25 before reaching 12% in FY26, following its 17% FY24 high.
What do Kewal Kiran’s working capital, cash flow and returns show?
Kewal Kiran reported return on equity, or ROE, of 17.3% in FY26, down from 25.2% in FY24 and 17.9% in FY22. Shareholders’ funds increased to Rs 820 crore at March 2026 from Rs 547 crore at March 2024, while PAT was Rs 153 crore in FY26 compared with Rs 154 crore in FY24. The comparison shows that the expansion in shareholders’ funds was not matched by higher PAT over those two years.
Working-capital days were 147 in FY26, nearly unchanged from 148 days in FY25 but above 102 days in FY24. Inventories rose to Rs 258 crore at March 2026 from Rs 82 crore at March 2024, while trade receivables increased to Rs 321 crore from Rs 203 crore. Kewal Kiran notes that the FY25 working-capital-days figure was adjusted for Kraus annualised sales numbers.
Cash flow recovered in FY26. Net cash from operating activities was Rs 183 crore in FY26, compared with Rs 14 crore in FY25 and Rs 136 crore in FY24. The cash-flow statement records a Rs 141 crore working-capital change in FY25, compared with a Rs 10 crore change in FY26, while net cash used in investing activities was Rs 184 crore in FY25 and Rs 28 crore in FY26.
Kewal Kiran reported net cash of Rs 304 crore at March 31, 2026 and Rs 338 crore at September 30, 2026, including investments but excluding investment in the joint venture. Cash and investments were Rs 384 crore at September 30, 2026, while total debt was Rs 46 crore. This net-cash presentation is separate from the historical balance-sheet line items.
Conclusion
Kewal Kiran’s FY22-FY26 record shows that operating profit expanded faster than revenue, with EBITDA rising from Rs 100 crore to Rs 238 crore against revenue growth from Rs 608 crore to Rs 1,213 crore. However, PAT was Rs 153 crore in FY26, near its Rs 154 crore FY24 level, as PAT margin, EBIT margin and ROE were below their FY24 readings.
Subsequent disclosures will show whether the FY26 EBITDA margin of 20% is maintained, whether working-capital days move below 147 after the FY25 Kraus adjustment, and whether retail’s 56% share of revenue changes further. The reported net-cash position increased by Rs 34 crore between March 31, 2026 and September 30, 2026, to Rs 338 crore.