










KPI Green Energy EBITDA rises 21% while H1 profit falls 18%
Key highlights
- KPI Green Energy’s H1 FY27 EBITDA rose 21% to Rs 545 crore, and its margin increased to 38% from 36%.
- KPI Green Energy’s H1 FY27 PAT fell 18% to Rs 187 crore as interest cost rose 112% to Rs 172 crore.
- KPI Green Energy’s debt rose to Rs 5,961 crore at H1 FY27 from Rs 2,141 crore at H1 FY26.
- KPI Green Energy’s H1 FY27 operating cash flow increased 50% to Rs 406 crore.
powered by IRIS
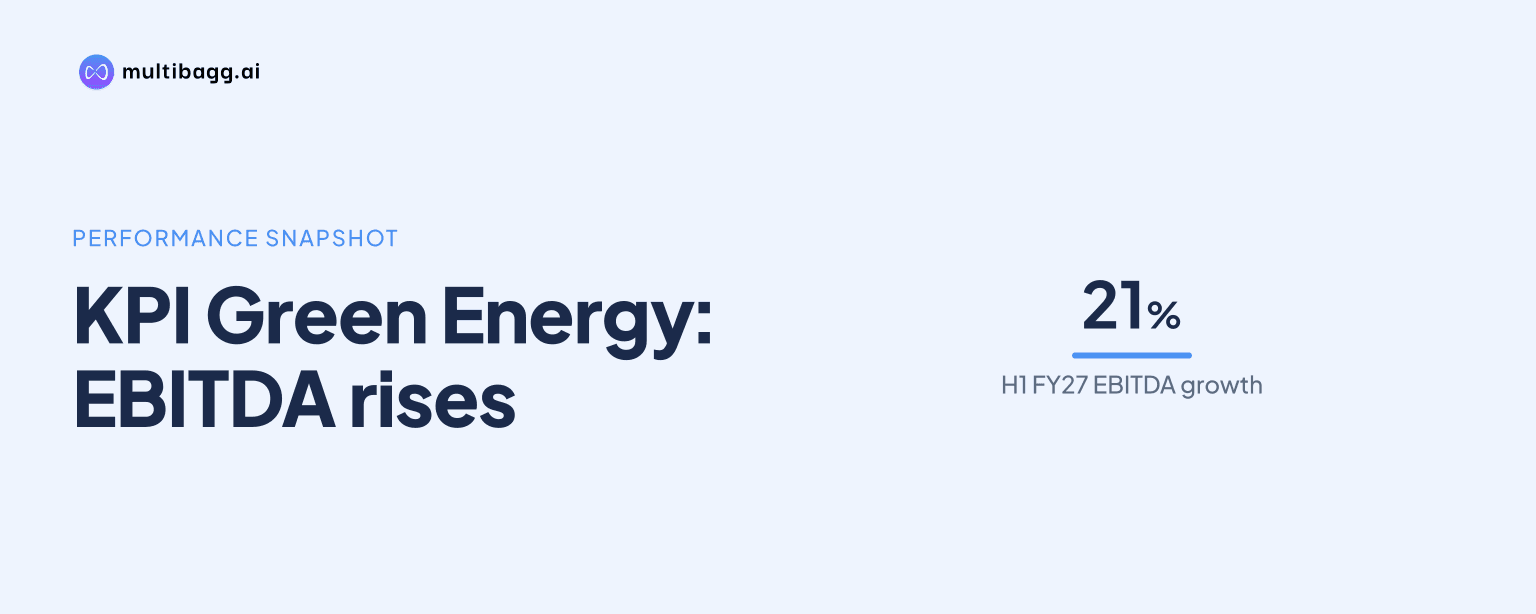
KPI Green Energy Limited grew EBITDA 21% to Rs 545 crore in H1 FY27, yet profit after tax fell 18% to Rs 187 crore as interest cost rose 112% to Rs 172 crore and depreciation rose 82% to Rs 111 crore. Debt stood at Rs 5,961 crore, versus Rs 2,141 crore in H1 FY26.
Know KPI Green Energy inside out
Results, valuation, peers and who's buying, in one view.
What drove KPI Green Energy’s H1 FY27 operating growth?
KPI Green Energy’s operating growth was led by income rising faster than total expenses in H1 FY27. Revenue from operations increased 15% to Rs 1,421 crore from Rs 1,237 crore, while total income rose 16% to Rs 1,451 crore from Rs 1,255 crore. Total expenses increased 12% to Rs 906 crore from Rs 806 crore.
Earnings before interest, tax, depreciation and amortisation, or EBITDA, rose 21% to Rs 545 crore from Rs 449 crore. The EBITDA margin increased to 38% from 36%, while FY26 EBITDA was Rs 1,006 crore at a 37% margin. This shows that the H1 FY27 margin was above the full-year FY26 level reported in the presentation.
The Q2 FY27 result followed the same pattern. Total income increased 16% to Rs 741 crore from Rs 641 crore, and EBITDA grew 22% to Rs 283 crore from Rs 232 crore. Q2 FY27 EBITDA margin was 38%, compared with 36% in Q2 FY26.
Why did KPI Green Energy’s H1 FY27 profit fall?
KPI Green Energy’s H1 FY27 profit fell because interest and depreciation increased by more than the rise in EBITDA. Interest cost increased 112% to Rs 172 crore from Rs 81 crore, while depreciation and amortisation rose 82% to Rs 111 crore from Rs 61 crore. Together, those charges increased by Rs 141 crore, against a Rs 96 crore increase in EBITDA.
Profit before tax consequently declined 15% to Rs 261 crore from Rs 307 crore, even as tax expense declined 5% to Rs 75 crore from Rs 79 crore. Profit after tax, or PAT, fell to Rs 187 crore from Rs 228 crore, and PAT margin narrowed to 13% from 18%. Basic earnings per share declined 21% to Rs 8.50 from Rs 10.80.
Management attributed the Q2 FY27 decline in PAT to higher depreciation and finance costs on a growing asset base, and said full earnings contribution is expected to materialise during the year. In Q2 FY27, interest cost rose 114% to Rs 92 crore and depreciation increased 88% to Rs 60 crore. Q2 PAT declined 21% to Rs 92 crore from Rs 117 crore.
Got a follow-up? Ask IRIS
How much did KPI Green Energy’s leverage increase?
KPI Green Energy’s debt increased to Rs 5,961 crore at H1 FY27 from Rs 2,141 crore at H1 FY26, while debt-to-equity rose to 1.84 times from 0.81 times. The company defines debt as long-term plus short-term borrowings, excluding lease liabilities. Equity used for this ratio excludes minority interest and rose to Rs 3,235 crore from Rs 2,650 crore.
The consolidated balance sheet expanded alongside the higher borrowings. Net worth increased 23% to Rs 3,525 crore from Rs 2,871 crore, while fixed assets rose 125% to Rs 6,993 crore from Rs 3,102 crore. Total assets and liabilities were Rs 12,037 crore at H1 FY27, compared with Rs 6,164 crore at H1 FY26.
The presentation reports equity of Rs 3,235 crore for the debt-to-equity calculation and net worth of Rs 3,525 crore in the consolidated balance sheet. These are separate disclosed measures. The increase in fixed assets, debt and depreciation is consistent with management’s description of a growing asset base in Q2 FY27.
Did KPI Green Energy generate more operating cash in H1 FY27?
KPI Green Energy generated more operating cash in H1 FY27, with cash flow from operating activities rising 50% to Rs 406 crore from Rs 270 crore. EBITDA rose 21% to Rs 545 crore in the same period, leaving operating cash flow Rs 139 crore below EBITDA. Both figures increased from H1 FY26.
Cash used in investing activities increased to Rs 1,482 crore from Rs 1,172 crore, while financing cash inflow rose to Rs 1,183 crore from Rs 974 crore. The company reported a net increase in cash and cash equivalents of Rs 107 crore, compared with Rs 73 crore in H1 FY26.
Cash and cash equivalents at the end of H1 FY27 were Rs 224 crore, versus Rs 192 crore at the end of H1 FY26. Beginning-period cash was Rs 116 crore in H1 FY27 and Rs 119 crore in H1 FY26. The cash-flow statement therefore records larger operating and financing inflows alongside a larger investing outflow during the six-month period.
Conclusion
KPI Green Energy’s H1 FY27 results show higher operating earnings and cash generation alongside lower reported profit. EBITDA increased by Rs 96 crore and operating cash flow by Rs 136 crore, but interest and depreciation together increased by Rs 141 crore. That gap contributed to PAT falling by Rs 41 crore and the PAT margin declining by 5 percentage points to 13%.
The next disclosed development to watch is management’s expectation that the growing asset base will make its full earnings contribution during the year. Subsequent results can show whether fixed assets of Rs 6,993 crore support earnings while debt of Rs 5,961 crore, debt-to-equity of 1.84 times and financing cash inflow of Rs 1,183 crore change.