










KPI Green portfolio hits 8.33 GW as orders outpace delivery
Key highlights
- KPI Green reported an 8.33 GW portfolio at Sep-26, up from 4.15 GW at Sep-25.
- KPI Green secured 4.18 GW of new orders and commissioned 1.96 GW during the year to Sep-26.
- KPI Green’s EPC portfolio was 5.11 GW at Sep-26, compared with 3.22 GW for IPP.
- KPI Green reported 53.6 crore kilowatt-hours of IPP generation in H1FY27, 31% above FY26’s full-year total.
powered by IRIS
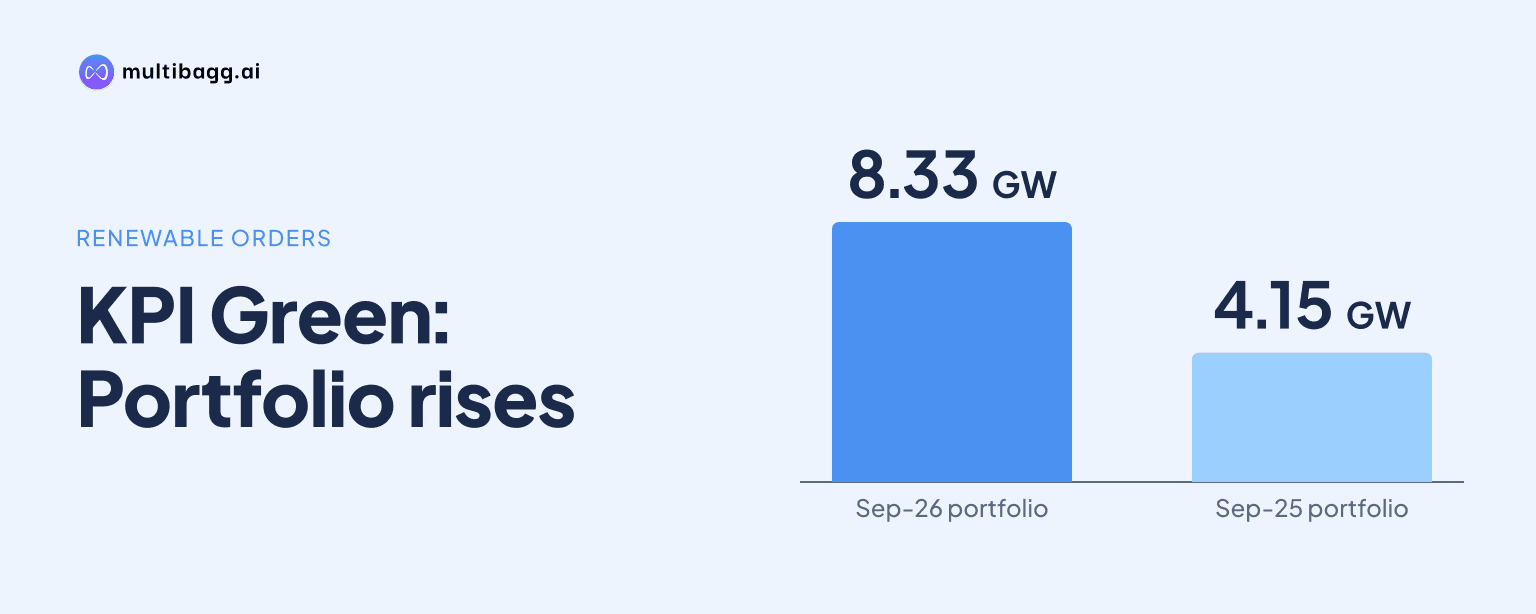
KPI Green Energy Limited reached an 8.33 gigawatt (GW) renewable portfolio at Sep-26, up 100.7% from 4.15 GW a year earlier, after securing 4.18 GW of new orders and commissioning 1.96 GW. KPI Green’s portfolio comprised 5.11 GW in engineering, procurement and construction (EPC) and 3.22 GW in independent power producer (IPP) activities.
Know KPI Green Energy inside out
Results, valuation, peers and who's buying, in one view.
How did KPI Green reach 8.33 GW by Sep-26?
KPI Green reached 8.33 GW by raising operational capacity to 3.02 GW and work in progress (WIP) to 5.31 GW at Sep-26. At Sep-25, it had 1.06 GW operational and 3.09 GW under construction, producing a 4.15 GW total. The year-on-year increase therefore included both commissioning and additions to the construction pipeline.
KPI Green reported 4.18 GW of fresh orders and 1.96 GW commissioned during the year to Sep-26. Orders exceeded commissioning by 2.22 GW, equal to the reported increase in WIP from 3.09 GW to 5.31 GW. This shows that new project intake increased the construction base while capacity was simultaneously brought into operation.
Which segment contributed most to KPI Green’s expansion?
EPC was the larger segment at Sep-26, with a 5.11 GW portfolio compared with 3.22 GW in IPP. EPC increased from 2.43 GW at Sep-25, while IPP increased from 1.72 GW. The EPC portfolio was consequently 1.89 GW larger than the IPP portfolio at the latest reported date.
KPI Green’s EPC installed capacity rose from 0.56 GW at Sep-25 to 1.68 GW at Sep-26, while EPC WIP increased from 1.87 GW to 3.43 GW. The company reported 2.68 GW of new EPC orders and 1.12 GW commissioned in the segment. IPP recorded 1.50 GW of new orders and 0.84 GW commissioned, increasing installed IPP capacity from 0.50 GW to 1.34 GW.
KPI Green describes EPC as construction of renewable plants for customers, with asset ownership transferring to the customer after delivery and potential long-term operations and maintenance work. It describes IPP as utility-scale solar, wind, hybrid and battery assets it owns and operates, supported by 25-year power purchase agreements (PPAs) with utilities and long-term commercial and industrial off-takers.
What portion of KPI Green’s IPP portfolio is operational?
KPI Green reported 1.34 GW of commissioned IPP capacity within its 3.22 GW IPP portfolio at Sep-26. The balance comprised 0.51 GW of operational wind assets under acquisition and 1.37 GW under execution. The presentation includes the acquisition assets in IPP WIP and says the transaction remains under process.
The commissioned IPP disclosures include 240 megawatt-peak (MWp) of solar capacity for GUVNL, 92 MWp of hybrid capacity for GUVNL, and 197 MWp of solar or hybrid capacity for commercial, industrial and KUSUM customers. KPI Green also reported phased energisation of 511 MWp under a 677 MWp GUVNL hybrid project and 301 MWp under a 350 MWp GUVNL solar project.
The IPP projects under execution include 150 megawatts (MW) of GUVNL wind capacity, 565 MW of battery energy storage system (BESS) capacity, 300 MW of wind capacity for SJVN, and 143 MWp of solar or hybrid capacity for commercial and group-captive customers. The BESS portfolio represents 1,130 megawatt-hours (MWh), while financial closure had been achieved for the 150 MW wind project and remained under process for the BESS projects.
Got a follow-up? Ask IRIS
How is KPI Green supporting delivery of its pipeline?
KPI Green reported 8,807 acres of owned and leased land at Sep-26, up 32% from 6,680 acres at Sep-25. It also reported 5,201 MW of power-evacuation capacity, 50% above 3,464 MW a year earlier. Management says that securing land and grid connectivity ahead of orders or PPAs supports project conversion and execution timelines.
The reported resource base has risen from 1,670 acres of land and 1,205 MW of evacuation capacity at Sep-23. By Sep-26, land had increased by 7,137 acres and evacuation capacity by 3,996 MW. KPI Green notes that both measures include assets developed or executed for company-owned projects as well as customer projects.
KPI Green also reported more than 2,200 kilometres of power-transmission network and more than 1,100 deployed water-less robotic cleaning units. Its in-house manufacturing covers solar and wind support structures, towers and power substation systems. These resources relate to execution across its 5.31 GW WIP portfolio rather than representing additional generation capacity.
What has the larger IPP portfolio changed in generation and revenue mix?
KPI Green reported 53.6 crore kilowatt-hours of IPP generation in H1FY27, 31% above the 41.0 crore kilowatt-hours reported for the full FY26. The company reported 24.9 crore kilowatt-hours in FY25 and 20.1 crore kilowatt-hours in FY24. The output increase coincided with IPP installed capacity reaching 1.34 GW at Sep-26.
KPI Green’s revenue-mix table reports IPP at 14% in Q2FY27, compared with 8% in Q2FY26 and 17% in Q1FY27. The presentation headline separately states an IPP revenue share of 15% in Q2FY27, a one-percentage-point difference from the table. The table’s non-IPP category represented 86% in Q2FY27, down from 92% a year earlier.
The annual generation comparison shows H1FY27 output already exceeded each disclosed full-year total from FY23 to FY26. However, the quarterly revenue-mix table shows IPP’s share declined from 17% in Q1FY27 to 14% in Q2FY27, despite increasing from 8% in Q2FY26. The presentation does not provide a numerical explanation for the quarter-on-quarter movement.
Conclusion
KPI Green’s 8.33 GW portfolio at Sep-26 combined 3.02 GW of operational capacity and 5.31 GW of WIP after 4.18 GW of orders outpaced 1.96 GW of commissioning. EPC accounted for 5.11 GW of the portfolio, while the 3.22 GW IPP segment supported reported H1FY27 generation of 53.6 crore kilowatt-hours.
The disclosed items to watch are the 0.51 GW operational wind-asset acquisition that remains under process, financial closure for the 565 MW and 1,130 MWh BESS projects, and progress on 1.37 GW of IPP capacity under execution. These developments will determine how much of the current WIP portfolio converts into commissioned capacity.