










Kranti Industries Limited returned to FY26 profit at Rs 1.56 crore
Key highlights
- Kranti Industries reported consolidated FY26 PAT of Rs 1.56 crore, reversing a Rs 3.08 crore loss in FY25.
- Consolidated FY26 revenue rose Rs 21.96 crore to Rs 100.45 crore from Rs 78.49 crore in FY25.
- Consolidated FY26 EBITDA increased to Rs 11.73 crore and EBITDA margin rose to 11.7% from 7.2%.
- FY24 consolidated PAT was a positive Rs 8 lakh, despite a PBT loss of Rs 1 crore.
powered by IRIS
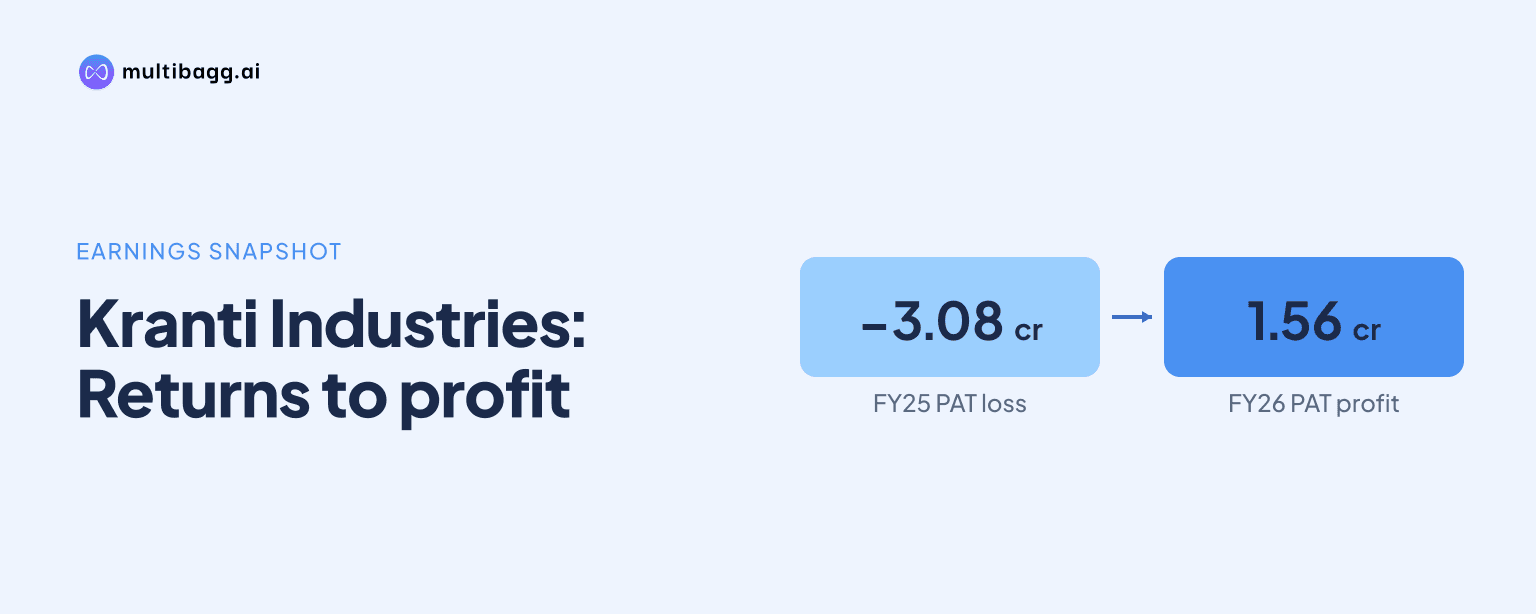
Kranti Industries Limited returned to consolidated profit in FY26, reporting profit after tax of Rs 1.56 crore after a Rs 3.08 crore loss in FY25, as revenue climbed Rs 21.96 crore to Rs 100.45 crore and EBITDA more than doubled to Rs 11.73 crore.
Know Kranti Industries inside out
Results, valuation, peers and who's buying, in one view.
How did Kranti Industries return to consolidated profit in FY26?
Kranti Industries returned to consolidated profitability in FY26 with profit after tax, or PAT, of Rs 1.56 crore, compared with a Rs 3.08 crore loss in FY25. Profit before tax, or PBT, also turned positive at Rs 2.01 crore after a Rs 4.45 crore loss in FY25. The presentation reports a FY26 PAT margin of 1.6% and a PBT margin of 2.0%.
The net-profit reversal coincided with higher operating earnings. Earnings before interest, tax, depreciation and amortisation, or EBITDA, rose to Rs 11.73 crore in FY26 from Rs 5.68 crore in FY25, while profit before depreciation and tax, or PBDT, increased to Rs 8.87 crore from Rs 2.39 crore. EBITDA therefore rose by Rs 6.05 crore and PBDT by Rs 6.48 crore over the year.
FY24 requires a distinction from FY25. Kranti Industries reported a consolidated PAT of Rs 8 lakh in FY24, so it remained marginally profitable at the net level, despite reporting a PBT loss of Rs 1 crore. FY26 was consequently a return from the FY25 net loss, rather than a recovery from PAT losses in both FY24 and FY25.
What changed in Kranti Industries revenue during FY26?
Kranti Industries reported consolidated revenue of Rs 100.45 crore in FY26, an increase of Rs 21.96 crore from Rs 78.49 crore in FY25. FY26 revenue also exceeded each of the previous four years presented, including Rs 93.72 crore in FY22, Rs 93.24 crore in FY23 and Rs 90.29 crore in FY24. The presentation states a FY22-to-FY26 revenue compound annual growth rate, or CAGR, of 1.7%.
Revenue had declined for two consecutive years before FY26. It fell from Rs 90.29 crore in FY24 to Rs 78.49 crore in FY25, after a reduction from Rs 93.24 crore in FY23 to Rs 90.29 crore in FY24. The FY26 result reversed that sequence and was Rs 6.73 crore above FY22 revenue, although the stated 1.7% CAGR shows limited expansion across the full FY22-to-FY26 period.
The consolidated figures are separate from the standalone financials also presented by Kranti Industries. Standalone revenue was Rs 93.88 crore in FY26, Rs 6.57 crore below consolidated revenue of Rs 100.45 crore. Standalone PAT was Rs 2.60 crore in FY26, compared with consolidated PAT of Rs 1.56 crore, showing that the two reporting bases produced different profit outcomes.
Got a follow-up? Ask IRIS
How did Kranti Industries margins develop across five years?
Kranti Industries reported a gross profit margin of 43.9% in FY26, its highest level in the FY22-to-FY26 record, compared with 39.8% in FY25 and 34.8% in FY22. Gross profit rose to Rs 44.10 crore in FY26 from Rs 31.22 crore in FY25. The presentation gives gross profit a 7.8% CAGR over FY22 to FY26, above the 1.7% revenue CAGR.
EBITDA margin rose to 11.7% in FY26 from 7.2% in FY25. It was also above the margins of 9.7% in FY22, 10.1% in FY23 and 9.9% in FY24. EBITDA reached Rs 11.73 crore in FY26, compared with Rs 9.10 crore in FY22, while the presentation reports a 6.5% FY22-to-FY26 EBITDA CAGR.
The movement from operating profit to net profit was less complete than the gross-profit and EBITDA margin gains. PBDT margin was 8.8% in FY26, below 11.8% in FY23, while PBT margin was 2.0%, below 7.4% in FY23. PAT margin of 1.6% in FY26 was below 2.4% in FY22 and 5.6% in FY23, although it followed the FY25 net loss.
What does Kranti Industries' five-year record show about earnings volatility?
Kranti Industries' consolidated PAT moved from Rs 2.23 crore in FY22 to Rs 5.22 crore in FY23, then fell to Rs 8 lakh in FY24 before a Rs 3.08 crore loss in FY25 and a Rs 1.56 crore profit in FY26. FY26 restored positive net earnings but remained Rs 3.66 crore below the FY23 PAT figure and Rs 67 lakh below FY22.
Pre-tax results followed a similarly uneven path. Consolidated PBT rose from Rs 2.89 crore in FY22 to Rs 6.87 crore in FY23, then became losses of Rs 1 crore in FY24 and Rs 4.45 crore in FY25. FY26 PBT of Rs 2.01 crore reversed the loss but was Rs 4.86 crore below FY23, and the presentation does not explain why FY24 PBT was negative while PAT was Rs 8 lakh positive.
PBDT shows that the earnings decline began before the FY24 and FY25 PBT losses. PBDT fell from Rs 11.01 crore in FY23 to Rs 5.68 crore in FY24 and Rs 2.39 crore in FY25, before recovering to Rs 8.87 crore in FY26. Management's presentation states a 6.0% PBDT CAGR between FY22 and FY26, but the annual record includes both the FY25 trough and the FY26 rebound.
Conclusion
Kranti Industries' FY26 consolidated results reversed the FY25 net loss, with revenue rising to Rs 100.45 crore, EBITDA reaching Rs 11.73 crore and PAT returning to Rs 1.56 crore. Gross profit margin of 43.9% and EBITDA margin of 11.7% were the highest figures in the five-year presentation, while PAT and PBT remained below their FY23 levels.
The presentation discloses no future revenue, margin, profit or capital-expenditure target. The next point to watch is whether Kranti Industries provides an explanation or reconciliation for the FY24 combination of a Rs 1 crore consolidated PBT loss and Rs 8 lakh PAT profit, while subsequent results show whether FY26 earnings persist after the FY24 and FY25 volatility.